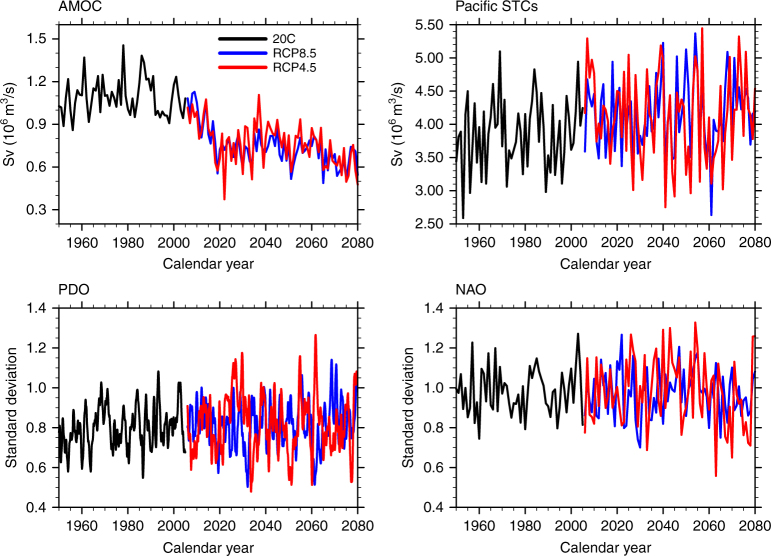
Fig. 6.
Time evolving intra-ensemble standard deviation for a given internal climate processes. AMOC Atlantic Meridional Overturning Circulation, Pacific STCs Pacific Subtropical Cells, PDO Pacific Decadal Oscillation, and NAO North Atlantic Oscillation. Black lines represent the intra-ensemble standard deviation for the twentieth century (1920–2005); blue lines are the intra-ensemble standard deviation for RCP8.5 (2006–2080); and red lines the intra-ensemble standard deviation for RCP4.5 (2006–2080)

