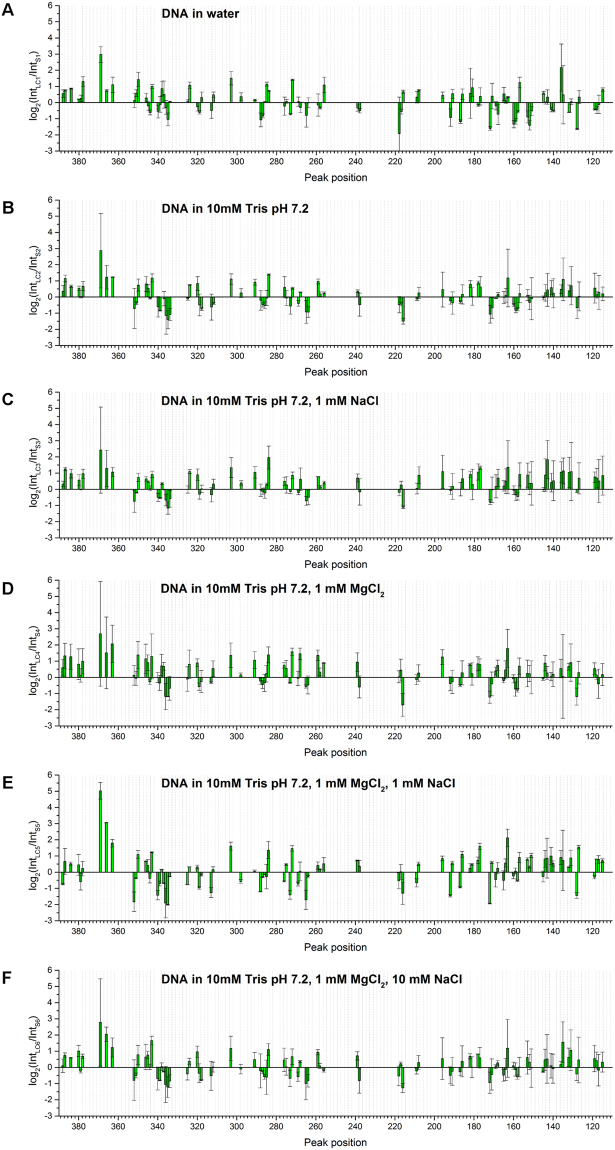
Figure 3.
Comparison of log2(IntLC/IntS) obtained for (A) LC1 compared with S1; (B) LC2 compared with S2; (C) LC3 compared with S3; (D) LC4 compared with S4; (E) LC5 compared with S5 and (F) LC6 compared with S6. Average values of log2(IntLC/IntS) from two separate measurements are shown with standard deviation as the error. Conditions given on the graphs represent liquid crystalline samples along with the corresponding solution samples.

