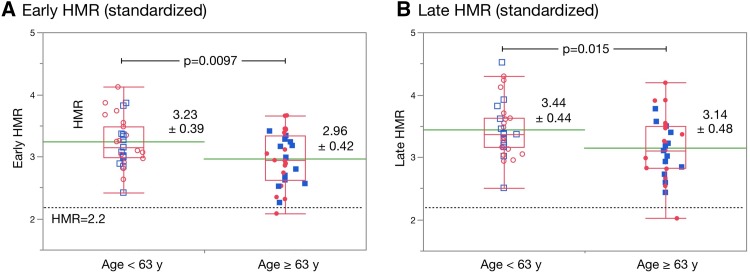
Fig. 2.
Early and late HMR in younger and older individuals. Early (a) and late (b) HMR in younger (age < 63 years) and older (≥ 63 years) individuals. Red and blue symbols, female and male individuals, respectively. Unfilled and filled symbols, younger (age < 63 years) and older (age ≥ 63 years) individuals, respectively. Box plot indicates median, 25 and 75% quartiles with whiskers at both ends. Green lines, mean values. Dotted line, HMR = 2.2 (lower limit of normal) as used in Japan using the JSNM working group database [15]

