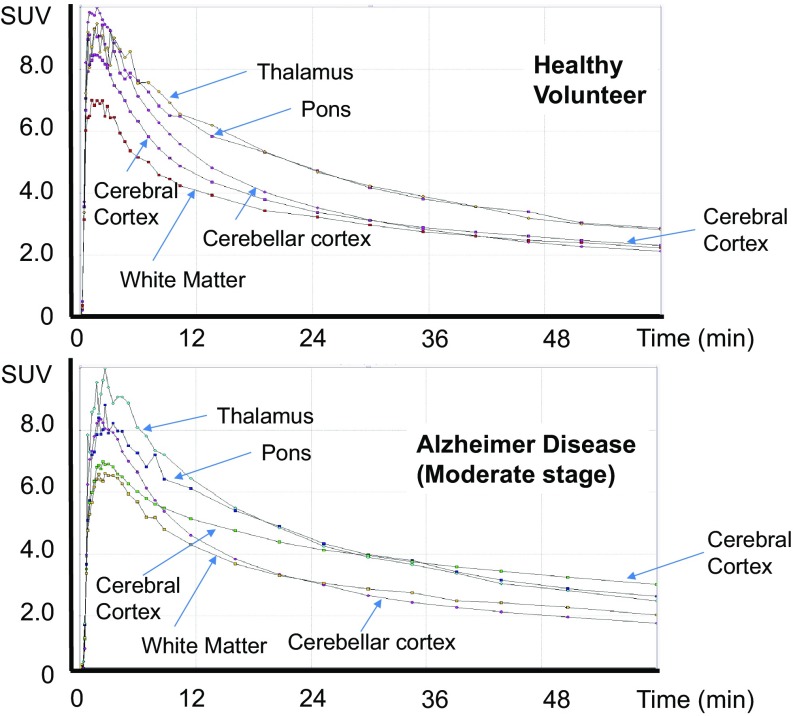
Fig. 2.
Time-activity-curves (TAC) of representative two cases; healthy volunteer (upper) and Alzheimer disease (moderate stage) (bottom). Regional TACs were shown for cerebral cortex (including frontotemporal lobe), white matter, cerebellar cortex, thalamus and pons. Subjects who showed similar TACs to mean TACs of each group were selected. Radioactivity was shown as Standardized Uptake Value (SUV) in this figure. In AD patients, TAC of cortex showed higher retention than that in healthy volunteers, and reached a plateau similar to the level of thalamus and pons

