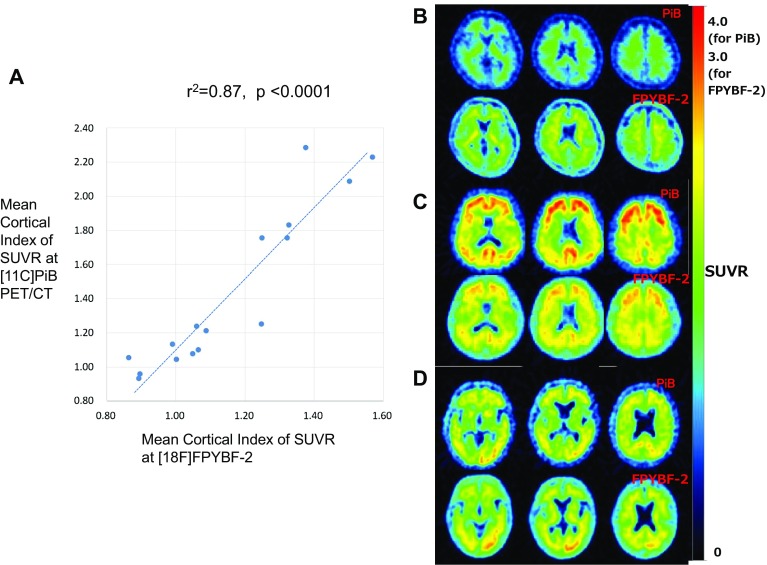
Fig. 4.
Comparison of Mean Cortical Index of SUVR at 11C-PiB and 18F-FPYBF-2 in the dual tracer study (a). Excellent linear correlation was observed between those of 11C-PiB and 18F-FPYBF-2 with statistical values (r2 = 0.87, p < 0.0001). Comparison of axial brain images of 11C-PiB (top three images in each case) and 18F-FPYBF-2 (bottom in each case) in three cases for example: a a case of normal volunteer (30 years old, male, MMSE = 30), b a case of moderate stage AD (78 years old, female, MMSE = 15), and c a case of early stage AD with a history of traumatic subarachnoid hemorrhage (76 years old, male, MMSE = 19). In the third case, amyloid deposition in left occipital lobe was prominent compared to right lobe both at 11C-PiB and 18F-FPYBF-2. Please note that window level of SUVR was set 0–3.0 for 18F-FPYBF-2 because of its narrow dynamic range, while it was set 0–4.0 for 11C-PiB

