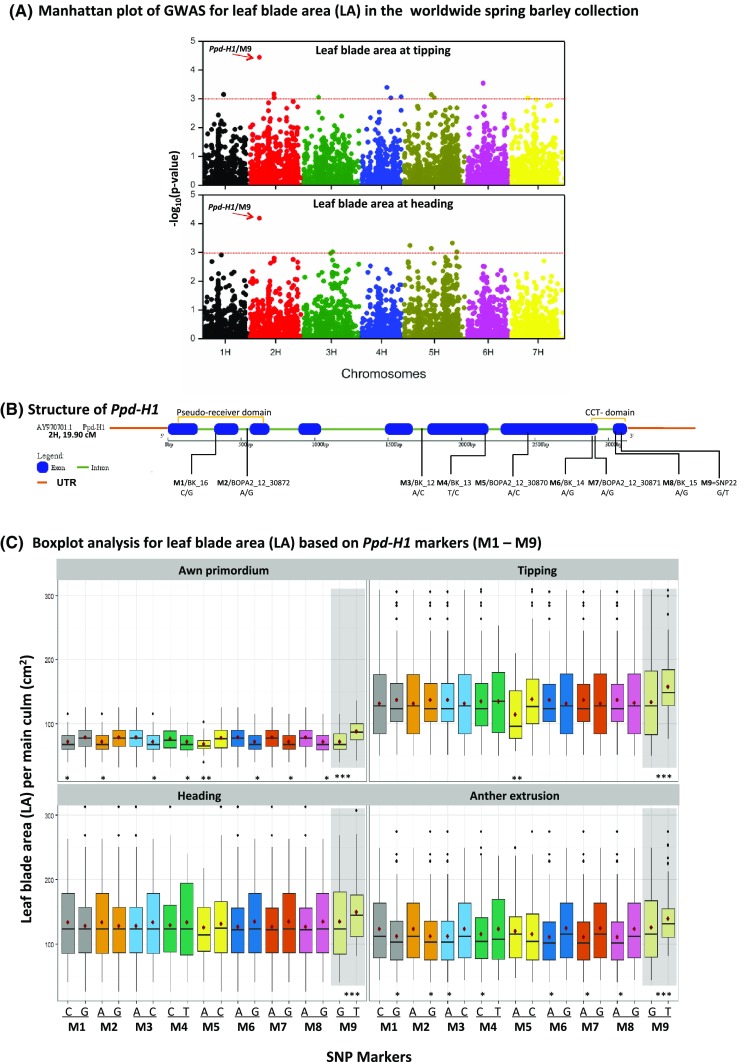
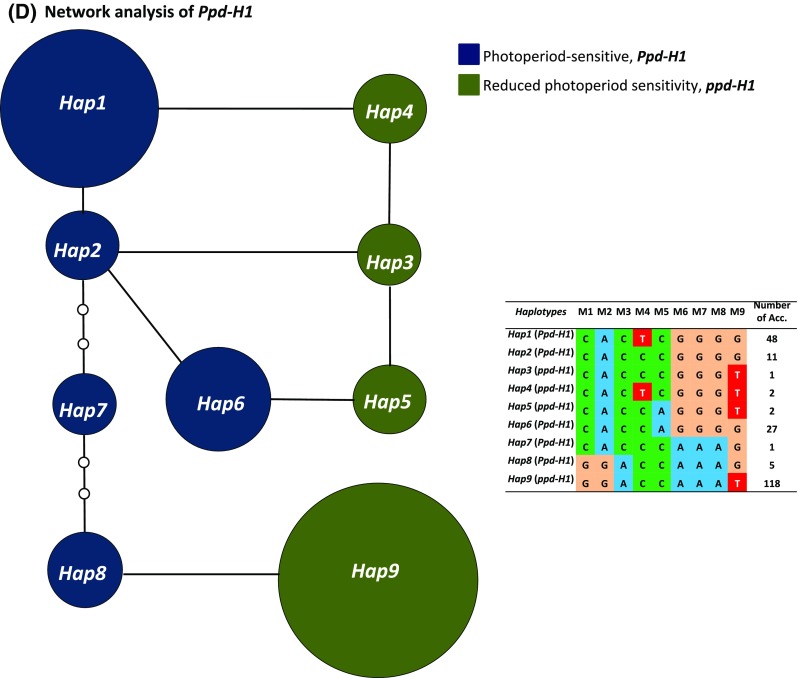
Fig. 1.


a Manhattan plot of GWAS for leaf blade area at tipping and heading stages; the red-arrow indicates the location of M9 at chromosome 2HS, and the red dotted line denote the threshold significance level, − log10 (P value of 0.001). b Ppd-H1 gene structure. c Box plot analysis of leaf area based on the nine SNPs derived from Ppd-H1. The degree of significance indicated as *P, 0.05; **P, 0.01; ***P, 0.001. Significant differences (P ≤ 0.05) were determined using LSD. Significant differences between the alleles of each marker were calculated at each developmental stage separately. d Network analysis of Ppd-H1 in 215 worldwide spring barley accessions, dark-blue for photoperiod-sensitive haplotypes and dark-green for reduced photoperiod sensitivity. Three biological replicates were used from each accession at each pre-anthesis developmental stage (n = 92 and 123 for photoperiod sensitive and reduced photoperiod sensitivity barley, respectively)
