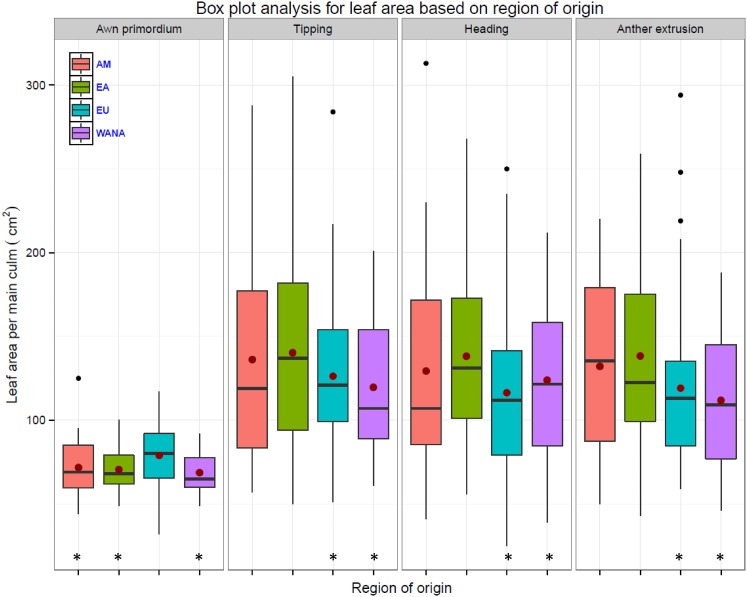
Fig. 3.
Box plot analysis of leaf blade area per the main culm at different developmental stages of 215 spring barley accessions from the different geographical region. Asterisk denotes leaf area significantly different at P ≤ 0.05 according to LSD between geographical region at the same developmental stage. The degree of significance indicated as *P, 0.05; **P, 0.01; ***P, 0.001 (n = 92 and 123 for Ppd-H1 and ppd-H1 barleys, respectively). Number of accessions for WANA = 45, EU = 105, EA = 37 and AM = 28

