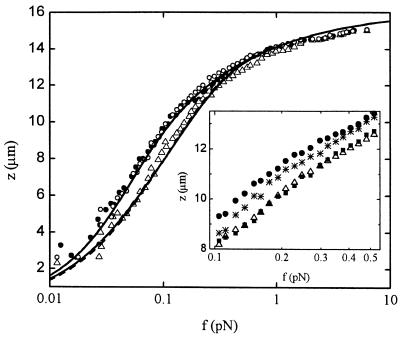
Figure 2.
Extension z versus force f curves for a λ-phage DNA molecule in protein solutions of different concentration: 0 nM IHF (full circles), 1,250 nM IHF (empty triangles), and 1,250 nM of mutant βR46C (empty circles). The data for 0 nM data were fitted with Eq. 2 (full line), assuming fixed persistence and molecular lengths A0 and L0, respectively. The 1,250 nM data were fitted with the full model (see text and ref. 22), assuming either IHF sliding along the DNA molecule (full line) or fixed IHF positions (dashed line). (Inset) Magnification of the region of maximal difference between experimental force–distance curves for different IHF concentrations, showing behavior at an intermediate concentration, 250 nM IHF (stars), as well as the absence of hysteresis at a typical large concentration, 1,250 nM. Extension (empty triangles) of the nucleoprotein complex is followed by retraction (full squares).

