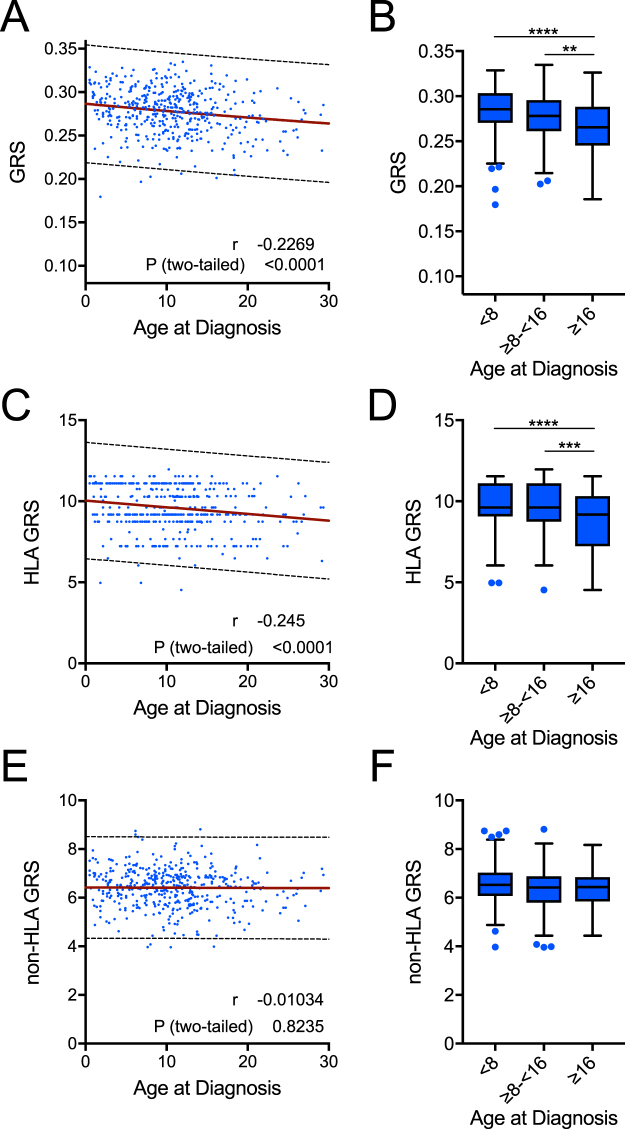
Figure 4.
HLA risk imparts a genetic association with age of disease onset. (A) The genetic risk score (GRS) was significantly and inversely correlated with age at diagnosis (linear regression analysis and Pearson correlation coefficient, P < 0.001, r = −0.227). (B) GRS was significantly different in patients when grouped into under 8, 8–16, and over 16 years old at diagnosis (Kruskal-Wallis ANOVA with Dunn’s posttest **P < 0.01, ****P < 0.0001). (C, D) The HLA-only GRS imparted a similar association with age at diagnosis as the full score (C: linear regression analysis and Pearson correlation coefficient, P < 0.001, r = −0.245; D: Kruskal-Wallis ANOVA with Dunn’s posttest *** P < 0.001, ****P < 0.0001). (E, F) The non-HLA GRS did not correlate with age at diagnosis (E: linear regression analysis and Pearson correlation coefficient, P > 0.05, r = −0.010; F: Kruskal-Wallis ANOVA with Dunn’s posttest P > 0.05). The 99% probability bands for linear regressions are depicted as dotted lines.

