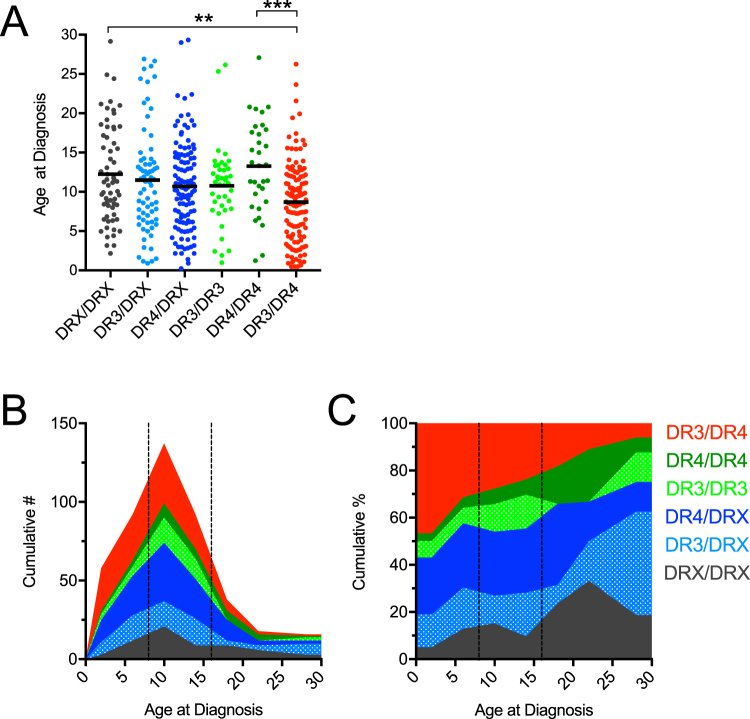
Figure 5.
HLA versus Age at Diagnosis. (A) Patients with the highest risk HLA-DR3/DR4 had a lower age at diagnosis. Kruskal-Wallis ANOVA with Dunn’s posttest **P < 0.01, ***P < 0.001. (B) Stacked histogram depicting the cumulative number of patients grouped by HLA type versus their ages at diagnosis (4 year binned). (C) Stacked histogram depicting the cumulative percent of patients grouped by HLA type versus their ages at diagnosis (4 year binned). (B,C) HLA-type is indicated by color as shown within the figure, and 8-year and 16-year age cutoffs are indicated by dashed lines.

