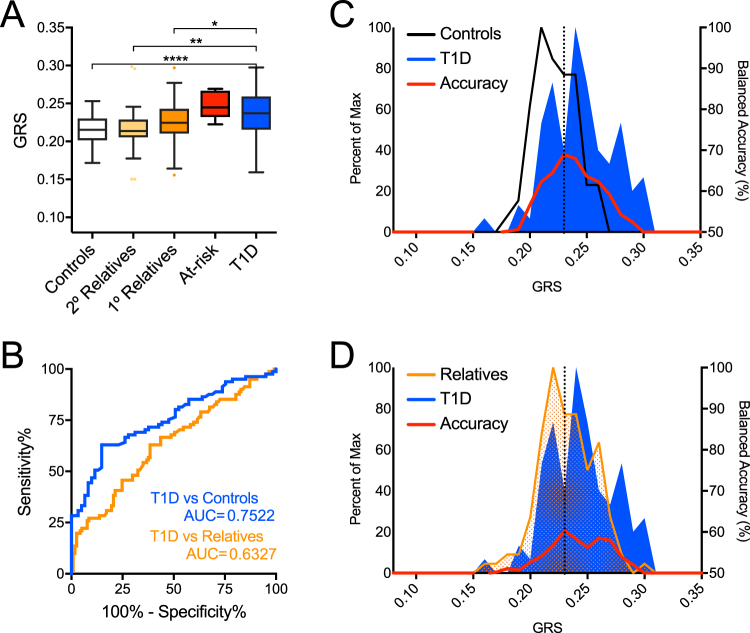
Figure 6.
GRS poorly discriminates African American (AFR) subjects with type 1 diabetes and high-risk relatives from controls and lower-risk relatives. (A) GRS was higher among type 1 diabetes patients (T1D, n = 84) and at-risk relatives (n = 6) compared to controls (n = 63), second-degree relatives (2° Relatives, n = 28), and first-degree relatives (1° Relatives, n = 118). Kruskal-Wallis ANOVA with Dunn’s posttest *P < 0.05, **P < 0.01, ****P < 0.0001. (B) Receiver operating characteristic (ROC) curve shows that the GRS discriminates type 1 diabetes patients from control subjects (T1D vs Controls) with 62.96% sensitivity yielding 85.25% specificity (area under curve (AUC) = 0.7522) and type 1 diabetes patients from first-degree relatives (T1D vs Relatives) with 62.96% sensitivity yielding 61.54% specificity (AUC = 0.6327). (C) Classifying subjects as T1D or Control. Peak balanced accuracy was determined to be 68.98% at a GRS of 0.233. (D) Classifying subjects as T1D or relatives. Peak balanced accuracy was 60.39% at a GRS of 0.233.

