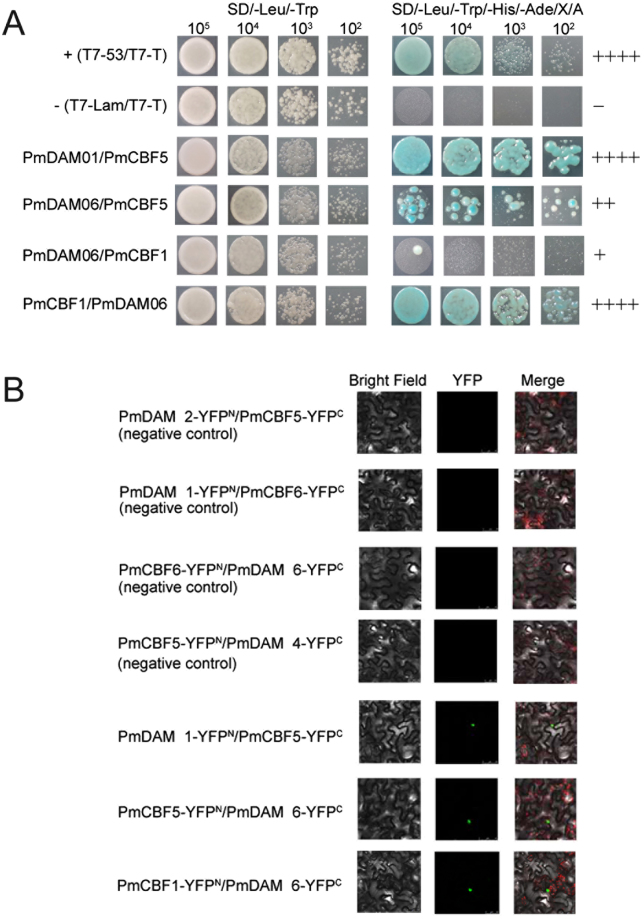
Figure 2.
Protein-protein interactions between PmCBFs and PmDAMs. (A) Yeast two-hybrid analysis of the protein interactions between PmCBFs and PmDAMs. T7-53/T7-T was positive control, and T7-Lam/T7-T was negative control. The symbol (+) was represented the capacity of the reaction. The more numbers of the symbol (+), the more stronger capacity of the reaction. (B) BiFC analysis of the protein interactions between PmCBFs and PmDAMs. The green fluorescent presented protein position. The red fluorescent showed the chloroplast position.

