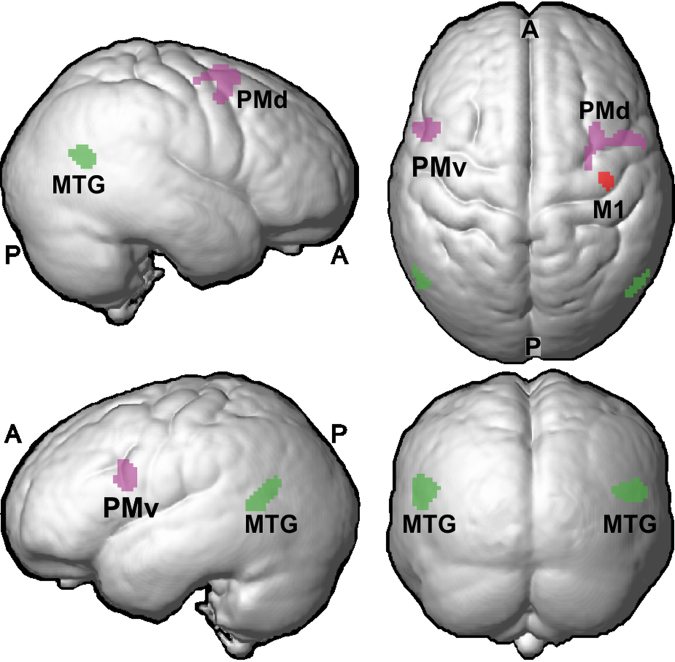
Figure 1.
Overview of cortical areas showing effect of median nerve injury. Magenta indicate premotor areas with reduced gray matter volume as compared to control participants (PMd, dorsal premotor cortex; PMv, ventral premotor cortex) and green indicates extrastriate visual areas with increased gray matter volume (MTG, middle temporal gyrus). Red indicates reduced gray matter volume in primary motor cortex (M1). Data averaged across participants and rendered on an average brain based on all participants in the study (n = 32) created using SPM8’s ‘Create Rendering/Surface’-function with DARTEL template in MNI-space (render depth, 20 mm; L, left; R, right; A, anterior; P, posterior).

