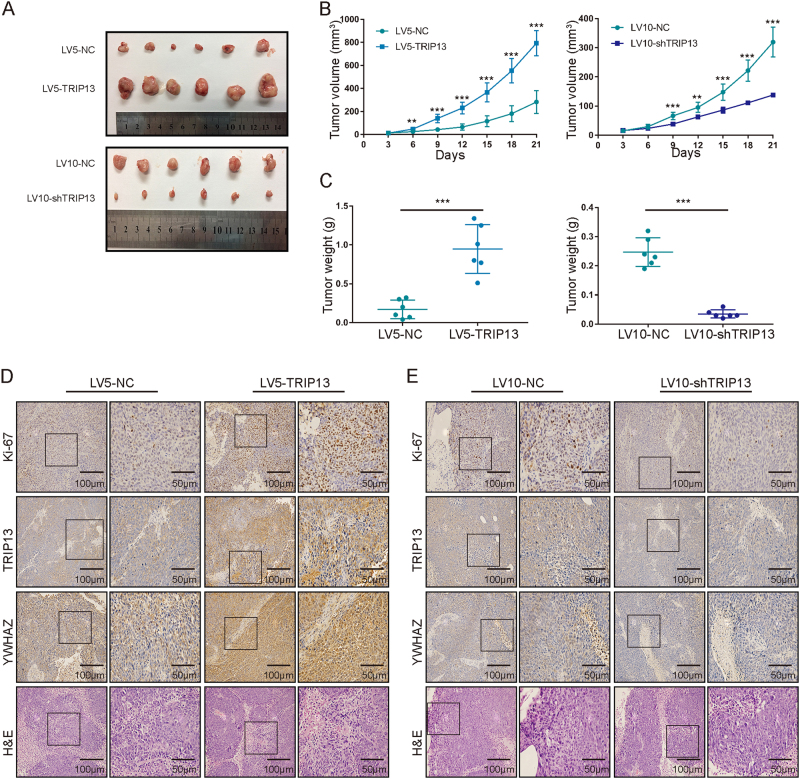
Fig. 5. Altered TRIP13 expression affects tumorigenicity in vivo.
a Tumors in nude mice bearing HCT116 cells in different groups. The upper panel is TRIP13 overexpression and the negative control; the lower panel is TRIP13 knockdown and the negative control. Each group contains six mice. b Statistical analysis of tumor volume in different groups. The left panel shows the overexpression and control groups, and the right panel shows the knockdown and control groups. The values indicate the mean ± standard deviation. n = 6/group. **p < 0.01; ***p < 0.001. c Statistical analysis of tumor weight in different groups. The left panel shows the overexpression and control groups, and the right panel shows the knockdown and control groups. The values indicate the mean ± standard deviation. n = 6/group. ***p < 0.001. d Representative staining images of TRIP13 overexpressing tumors. The bars are as indicated. e Representative staining images of TRIP13 knockdown tumors. The bars are as indicated

