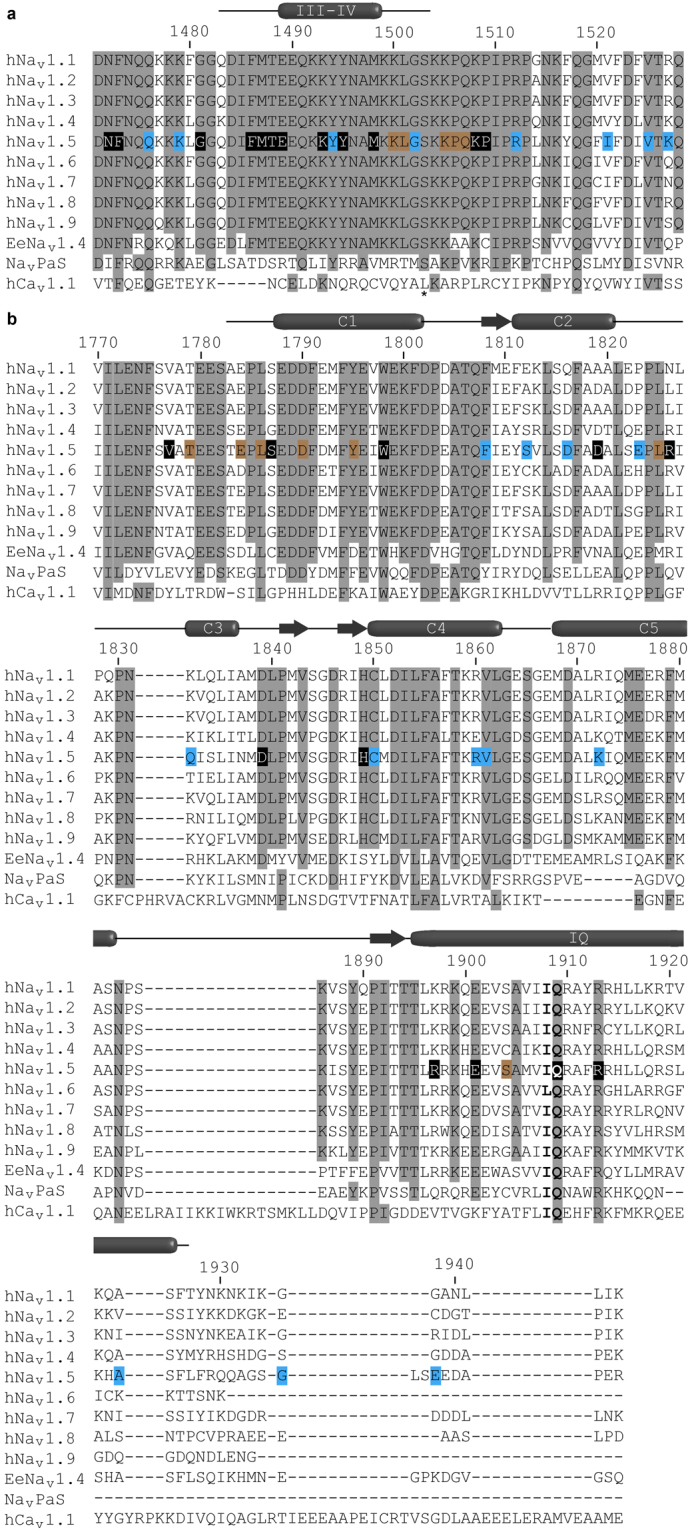
Figure 7.

Sequence alignment of mammalian voltage-gated sodium channel isoforms with NavPaS, EeNav1.4 and human CaV1.1. (a) III-IV linker region and (b) C-terminal domain region aligned with Clustal Omega. Fully conserved residues are shaded. Known disease associated residues in Nav1.5 are marked by boxes coloured according to their disease phenotype LQT3 (black), BrS (blue), or both (brown). The phosphorylation site in the III-IV linker is marked by an asterix51. Secondary structure has been annotated according to the DSSP calculations of Nav1.2 (PDB ID 1BYY) and Nav1.5 (PDB ID 4OVN) structures in the protein structure database.
