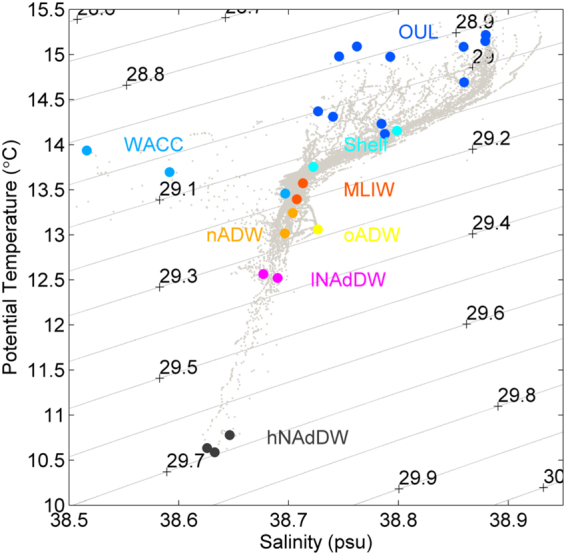
Figure 2.

T-S plot of CTD casts; all casts (grey dots) on the background. On the foreground, coloured dots show the location on the T-S plot of the samples considered in this study. The associated coloured labels identify the water mass: Shelf (Shelf Water), WACC (Western Adriatic Coastal Current), OUL (Offshore Upper Layer), MLIW (Modified Levantine Intermediate Water), lNAdDW (Northern Adriatic Dense Water, low content), hNAdDW (high content), nADW (newly generated Adriatic Deep Water) and oADW (old, resident Adriatic Deep Water); numbers correspond to density anomaly (kg m−3); lines inside the plot are isopycnals of potential density anomaly (kg m−3).
