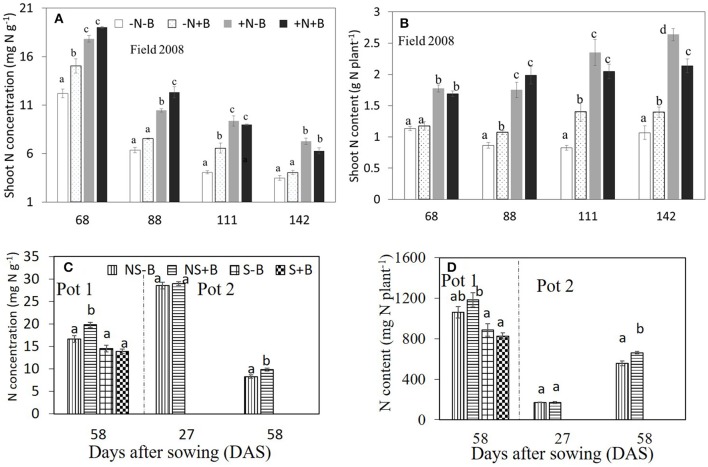
Figure 3.
Effects of N fertilizer supplies and benomyl on N concentration (A) and (C), and N uptake (B) and (D) by maize at different growth stages in the field (A,B; in 2008) and in the pots (C,D) experiments. Each value is the mean of four replicates (±SE). –N–B: no N fertilizer and no benomyl; –N+B: no N fertilizer and benomyl; +N–B, N fertilizer and no benomyl; +N+B, N fertilizer and benomyl. NS–B: non-sterilized soil and no benomyl; NS+B: non-sterilized soil and benomyl; S–B, sterilized soil and no benomyl; S+B, sterilized soil and benomyl. Different letters denote significant difference (P < 0.05) among the treatments at each growth stage.

