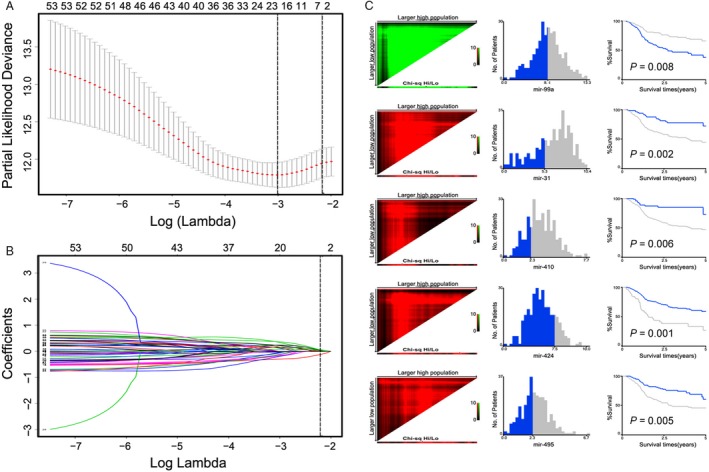
Figure 1.

miRNA selection using the least absolute shrinkage and selection operator (LASSO) logistic regression model. (A) Tuning parameter (Lambda, λ) selection cross‐validation error curve. The vertical lines were drawn at the optimal values by the minimum criteria and the 1‐SE criteria. We choose the right line by 1‐SE criteria where the value = −1.47 with λ = 0.033. (B) The coefficients of 56 differential miRNAs from LASSO model. A vertical line is drawn at the value chosen by 10‐fold cross‐validation. (C) X‐tile analysis of the 5 selected miRNAs. Red indicates inverse association between marker expression and overall survival, whereas green represents direct association.
