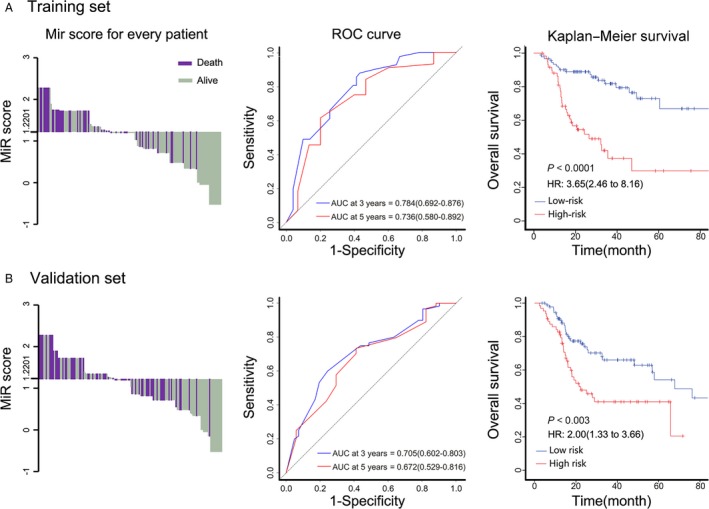
Figure 2.

MiR score by the 5‐miRNA signature, time‐dependent ROC curves, and Kaplan–Meier survival in the training and validation sets according to the 5‐miRNA signature. Left panels represent the bar diagrams of every patient's MiR score. It was shown that patients with MiR scores <1.2201 had better survival when compared with those with MiR scores more than 1.2201. Middle panels showed the ROC curves of training set and validation set. Right panels indicate Kaplan–Meier survival analysis of training set and validation set. ROC indicates receiver operating characteristic. AUC indicates area under curve. The AUC was assessed at 3 and 5 years, and the P value was acquired through log‐rank test. We calculated P values using the log‐rank test.
