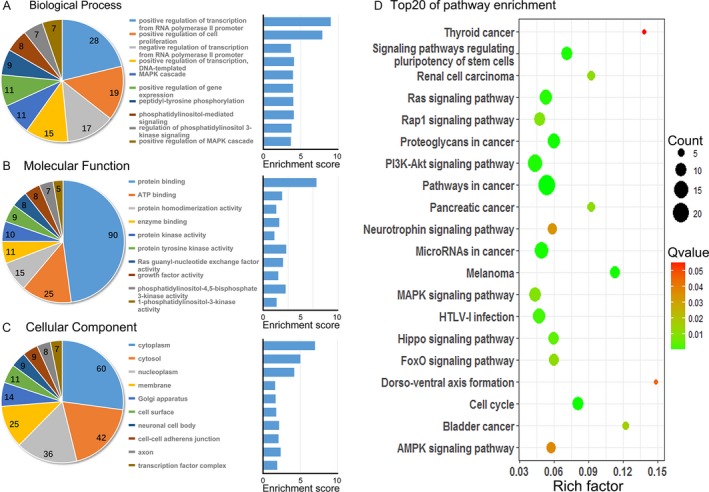
Figure 5.

Gene Ontology and pathway analysis of the predicted target gene from five selected miRNAs. (A–C) Top 10 Gene Ontology terms in three domains of the predicted gene. The pie plot means the number of target gene in each term. Enrichment = −log10 (adjust P value). (D) Top 20 pathways of the predicted genes. Rich factor = enrichment level. The magnitude of the pots = numbers of gene. The color classification = Qvalue (adjust P value).
