
Figure 2.
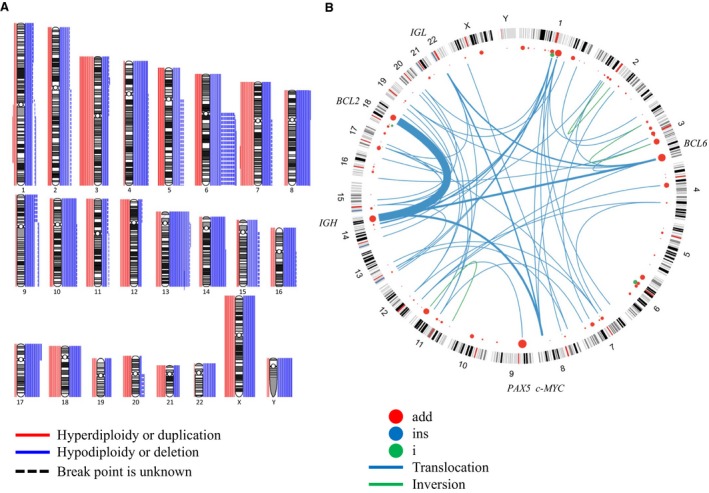
Numerical chromosomal abnormalities and chromosomal rearrangement break points/translocations. (A) Numerical abnormalities. Red lines on the left of each karyogram indicate gain or hyperdiploidy, and blue lines on the right indicate loss or hypodiploidy. In cases in which precise break points were not identified, dashed lines are shown. The number of lines for each chromosome shows the number of tumors with the abnormality. The frequent gains were +3 (N = 19), +7 (N = 18), and +18 (N = 16), and the frequent losses were −13 (N = 27), −14 (N = 20), −4 (N = 20), −8 (N = 19), and −10 (N = 20). (B) Structural abnormalities. Red points indicate break points of additional materials of unknown origins. The size of each point shows the number of tumors. Blue lines are chromosomal translocations. Each line weight shows the number of tumors. Abnormalities detected at a rate of >5.0% included chromosomal rearrangements involving 3q27 (N = 16), 7q22 (N = 7), 8q24 (N = 8), 9p13 (N = 11), 11q13 (N = 6), 14q32 (N = 29), and 18q21 (N = 20).