

Abstract
The human CGB5 gene encodes chorionic gonadotropin (hCG)β 5, which is aberrantly expressed in trophoblastic neoplasm and in some non‐trophoblastic neoplasms. Fucntional studies observed that it involved tumor initiation, growth, and metastatic outgrowth. In this study, using data from the International Cancer Genome Consortium (ICGC) and the Cancer Genome Atlas (TCGA)‐stomach adenocarcinoma (STAD), we assessed the independent prognostic value of CGB5 expression in patients with primary gastric cancer (GC). Results showed that CGB5 expression was nearly not expressed in normal GC tissues. In comparison, its expression was detected in 214 of the 415 primary GC cases (51.6%) in TCGA‐STAD and was associated with poor response to primary therapy and a higher risk of recurrence and death. In early stages, CGB5 expression was not a prognostic factor in terms of OS (HR: 1.448; 95% CI: 0.811–2.588, P = 0.211) or RFS (HR: 1.659; 95% CI: 0.778–3.540, P = 0.190). However, its expression was independently associated with unfavorable OS (HR: 1.719; 95% CI: 1.115–2.651, P = 0.014) and RFS (HR: 3.602; 95% CI: 1.708–7.598, P = 0.001) in advanced stages. Using deep sequencing data from TCGA‐STAD , we found that CGB5 expression was not related to its genetic amplification or DNA methylation in GC. Based on these findings, we infer that CGB5 expression is common in GC patients and its expression might independently predict poor OS and RFS in advanced stages, but not in early stages of GC.
Keywords: CGB5, gastric cancer, hCGβ, overall survival, recurrence‐free survival
Introduction
Human chorionic gonadotropin (hCG) is a glycoprotein hormone that plays an important role during pregnancy, such as modulation of implantation, placentation, placental angiogenesis, and maternal/fetal immune responses 1. As a glycoprotein hormone, hCG is a heterodimers consisting of a common α‐subunit and an unique β‐subunit which confers biological specificity. Previous studies found that the upregulation of free hCGβ is a marker of the trophoblastic neoplasm, such as choriocarcinoma 2 and its aberrant expression was also observed in some non‐trophoblastic neoplasms including endometrial carcinoma and ovarian 3, testicular 4, breast cancer 5, 6, and gastric carcinomas 7.
There are six genes clustered on chromosome 19q13.3 encoding the β‐subunit, including CGB1, CGB2, CGB3, CGB5, CGB7, and CGB8. CGB1 and CGB2 might encode a protein unrelated to hCG, while the rest four genes encode the two specific hCGβ proteins. CGB7 encodes a protein with an alanine at position 117, while CGB3, CGB5, and CGB8 encode an aspartic acid at this position 8. According to this difference, CGB7 was classified into type I gene, while the other three (CGB3, CGB5, and CGB8) were classified into type II genes 9. A series of previous studies found that dysregulated type II genes are involved in some tumor initiation, growth, and metastatic outgrowth 10, such as colorectal cancer 11 and ovarian cancer 12, 13. Among the type II genes, the oncogenic mechanisms of aberrantly expressed CGB5 have been characterized in ovarian cancer 12, 13.
hCGβ expression also has a prognostic value in some cancers. In urothelial carcinomas, hCGβ can potentially be used as a marker of patients’ clinical response to treatment 14. Elevated serum hCGβ and aberrant p53 expression were strongly associated with poor prognosis of serous ovarian carcinoma 3. One early study based on 54 patients with gastric cancer (GC) found that hCGβ‐positive cells can be found in the gastric tumor by immunohistochemical (IHC) staining 15. However, the expression profile of CGB5 and its prognostic value in GC remains obscure. In this study, using data from the Cancer Genome Atlas (TCGA), we assessed the independent prognostic value of the CGB5 expression in patients with primary GC.
Materials and Methods
Data mining in the International Cancer Genome Consortium (ICGC) and the Cancer Genome Atlas (TCGA)
The ICGC was launched in 2008 to coordinate large‐scale cancer genome studies in tumors from 50 cancer types and/or subtypes 16. In the specimen‐centric database, 371 primary GC cases with intact OS data were recorded. The OS data were downloaded using the UCSC Xena browser (https://xenabrowser.net/). In TCGA‐Stomach Adenocarcinoma (STAD), 415 GC samples and 35 normal gastric samples were included. Among the 415 patients, 388 cases had intact OS data recorded. The level‐3 data, including CGB5 expression (RNAseq ‐ IlluminaHiSeq UNC), age at initial diagnosis, gender, pathological stage, histological grade, radiation therapy, targeted molecular therapy, Helicobacter pylori infection, primary therapy outcome, residual tumor, recurrence status, and living status in this cohort, were also obtained using the UCSC Xena browser. Kaplan–Meier curves of OS and recurrence‐free survival (RFS) after primary therapy were generated by GraphPad Prism v6.0 (GraphPad Inc.).
CGB5 DNA methylation (Illumina 450k infinium methylation beadchip) and gene‐level thresholded GISTIC2‐processed copy‐number data, which defines genetic changes as homozygous deletion (−2), heterozygous loss −1), copy‐neutral (0), low‐level copy gain (+1), high‐level amplification (+2) were also downloaded from the Xena browser.
Examining of CGB5 protein expression
CGB5 expression at the protein level in normal human tissues and in cancer tissues was examined using IHC staining data in the Human Protein Atlas (HPA) (http://www.proteinatlas.org/) 17, 18.
Statistical analysis
Gastric cancer patients were divided into CGB5 expression positive (>0) and negative (=0) groups. Statistical analysis was performed using GraphPad Prism v6.0 and SPSS 19.0 (SPSS Inc. Chicago, IL, USA). Continuous variables were reported as means ± standard deviation (SD). The group difference was compared by two‐tailed Student's t‐test or ANOVA with Student–Newman–Keuls test as a post hoc test. The association between CGB5 expression and the clinicopathological characteristics was evaluated using χ 2 tests. Log‐rank test was performed to assess the significance of the difference between OS/RFS curves. The prognostic values of CGB5 expression in terms of OS and RFS were analyzed by univariate and multivariate Cox regression models. Linear regression analysis was conducted to assess the correlation between CGB5 expression and its DNA methylation. P < 0.05 was considered statistically significant.
Results
CGB5 expression profiles in GC and normal gastric tissues
By comparing CGB5 expression in TCGA‐STAD, we found that CGB5 expression was significantly higher in GC tissues (N = 415) than in normal gastric tissues (N = 35) (Fig. 1A). Among the 415 cases of GC, 214 cases (51.6%) had CGB5 expression (Fig. 1B). By examining CGB5 protein expression in the HPA, we found that CGB5 protein was nearly not detectable in all normal human tissues, except in placenta (Fig. 1C). In normal gastric glandular cells, CGB5 was not detectable by IHC staining (Fig. 1D). In comparison, in 11 cases of GC tissues examined by CGB5 antibody (HPA038934), not positive staining was observed (Fig. 1E, red arrow). However, due to small number of cases examined, we could not exclude the possibility that some GC tumors might be CGB5 positive.
Figure 1.

Comparison of CGB5 expression in different patient groups. (A) Comparison of CGB5 expression between GC cancer (N = 415) and normal gastric tissues (N = 35). (B) The expression profile of CGB5 in 415 patients. (C) CGB5 protein expression summary in normal human tissues. Data were obtained from: http://www.proteinatlas.org/ENSG00000189052-CGB5/tissue. (D) Representative images of CGB5 IHC staining in normal gastric tissues. (E). CGB5 protein expression summary in some human cancer. Data were obtained from: http://www.proteinatlas.org/ENSG00000189052-CGB5/pathology.
Comparison of CGB5 expression in different GC patient groups
By comparing CGB5 expression between patients with different clinicopathological parameters, we did not find significant difference between female and male patients (Fig. 2A) and among different stages of diseases (Fig. 2B). However, the patients with overall responses to primary therapy [complete remission (CR) and partial remission (PR)] had significantly lower CGB5 expression (Fig. 2C).
Figure 2.
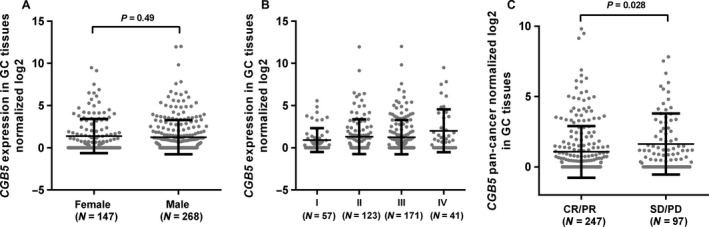
Comparison of CGB5 expression in different GC patient groups. (A–C) Comparison of CGB5 expression between female and male patients (A), in different pathological stages (B) and in patients with responses (CR+PR) and without responses (SD+PD) (C).
Then, we compared the clinical characteristics between the CGB5‐positive (>0) and CGB5‐negative (=0) groups (Table 1). Results showed that the CGB5‐positive group had a lower overall response rate (CR and PR] (110/173, 63.6%) than the CGB5‐negative group (137/171, 80.1%) (P = 0.0007; Table 1). In addition, we also observed significantly higher ratios of recurrence after primary therapy (49/161, 30.4%) and death (93/199, 46.7%) in the CGB5‐positive group compared with the negative group (23/163, 14.1%, and 64/189, 33.9%) (P = 0.0004 and 0.0098, respectively; Table 1).
Table 1.
The association between CGB5 expression and the clinical parameters in patients with primary GC in TCGA‐STAD
| Parameters | CGB5 expression | χ 2 | P value | |
|---|---|---|---|---|
| >0 (N = 214) | =0 (N = 201) | |||
| Age (Mean ± SD) | 65.43 ± 10.48 | 65.87 ± 10.92 | 0.68 | |
| Gender | ||||
| Female | 79 | 68 | 0.43 | 0.51 |
| Male | 135 | 133 | ||
| Pathological stage | ||||
| I/II | 92 | 88 | 0.023 | 0.88 |
| III/IV | 110 | 102 | ||
| Discrepancy+null | 12 | 11 | ||
| Histological grade | ||||
| G1/G2 | 82 | 78 | 0.024 | 0.88 |
| G3 | 128 | 118 | ||
| GX | 4 | 5 | ||
| Radiation therapy | ||||
| No | 153 | 147 | 0.15 | 0.70 |
| Yes | 38 | 33 | ||
| Discrepancy+null | 23 | 21 | ||
| Targeted molecular therapy | ||||
| No | 94 | 102 | 1.80 | 0.18 |
| Yes | 94 | 77 | ||
| Discrepancy+null | 26 | 22 | ||
| H. pylori infection | ||||
| No | 81 | 76 | 0.95 | 0.33 |
| Yes | 8 | 12 | ||
| Null | 125 | 113 | ||
| Primary therapy outcome | ||||
| CR+PR | 110 | 137 | 11.61 | 0.0007 |
| SD+PD | 63 | 34 | ||
| Discrepancy+null | 41 | 30 | ||
| Residual tumor | ||||
| R0 | 166 | 164 | 0.90 | 0.34 |
| R1 + R2 | 20 | 14 | ||
| RX+null | 28 | 23 | ||
| Recurrence status | ||||
| No | 112 | 140 | 12.49 | 0.0004 |
| Yes | 49 | 23 | ||
| Null | 53 | 38 | ||
| Living status | ||||
| Living | 106 | 125 | 6.67 | 0.0098 |
| Dead | 93 | 64 | ||
| Null | 15 | 12 | ||
GX, grade cannot be assessed; CR, complete remission; PR, partial remission; SD, stable disease; PD, progressive disease; R0, No residual tumor; R1, Microscopic residual tumor; R2, Macroscopic residual tumor; RX, The presence of residual tumor cannot be assessed; null, no data.
CGB5 expression was independently associated with poor OS in patients with advanced GC
To explore the association between CGB5 expression and OS in GC patients, we used both data from ICGC and TCGA. By generating Kaplan–Meier curves of OS, we found that CGB5 expression (>0) was associated with shorter OS in primary GC patients, no matter in ICGC (P = 0.0057) (Fig. 3A) or in TCGA‐STAD (P = 0.0014) (Fig. 3B). However, in subgroup analysis, we only confirmed the association in advanced stages (stage III/IV) (P = 0.0017) (Fig. 4B), but not in early stages (stage I/II) (P = 0.21) (Fig. 4A). To further investigate the independent prognostic value of CGB5 in terms of OS, univariate and multivariate analysis based on the COX regression model was conducted. In early stages, CGB5 expression was not a prognostic factor (HR: 1.448; 95% CI: 0.811–2.588, P = 0.211; Table 2). However, its expression was independently associated with poor OS in advanced stages (HR: 1.719; 95% CI: 1.115–2.651, P = 0.014; Table 3).
Figure 3.

Kaplan–Meier curves of OS in GC patients. (A–B) Kaplan–Meier curves of OS in GC patients. Survival curves were generated using data from ICGC (A) and TCGA (B). Patients were divided into CGB5‐positive (>0) and negative (=0) groups.
Figure 4.

Kaplan–Meier curves of OS in early and advanced stages of GC patients. (A–B) Kaplan–Meier curves of OS in early stages group (I/II) (A) or in advanced stages group (III/IV) (B). Data were generated using data from TCGA‐STAD. Patients were divided into CGB5‐positive (>0) and negative (=0) groups.
Table 2.
Univariate and multivariate analysis of OS/RFS in stage I/II patients in TCGA‐STAD
| Parameters | Univariate analysis | Multivariate analysis | ||||||
|---|---|---|---|---|---|---|---|---|
| P | HR | 95% CI (lower/upper) | P | HR | 95% CI (lower/upper) | |||
| OS | ||||||||
| Age (Continuous) | 0.495 | 1.010 | 0.982 | 1.038 | ||||
|
Gender Female vs. Male |
0.473 | 0.798 | 0.431 | 1.478 | ||||
|
Histological grade G3 vs. G1/G2 |
0.080 | 1.721 | 0.937 | 3.162 | ||||
|
Radiation therapy No vs. Yes |
0.521 | 1.330 | 0.557 | 3.174 | ||||
|
Targeted molecular therapy No vs. Yes |
0.761 | 0.911 | 0.498 | 1.665 | ||||
|
H. pylori infection No vs. Yes |
0.562 | 1.829 | 0.238 | 14.081 | ||||
|
Primary therapy outcome SD/PD vs. CR/PR |
0.000 | 3.333 | 1.726 | 6.437 | ||||
|
CGB5 expression >0 vs. =0 |
0.211 | 1.448 | 0.811 | 2.588 | ||||
| RFS | ||||||||
| Age (Continuous) | 0.713 | 1.006 | 0.973 | 1.040 | ||||
|
Gender Female vs. Male |
0.047 | 0.446 | 0.201 | 0.988 | 0.216 | 0.593 | 0.259 | 1.358 |
|
Histological grade G3 vs. G1/G2 |
0.174 | 1.631 | 0.806 | 3.299 | ||||
|
Radiation therapy No vs. Yes |
0.516 | 1.420 | 0.493 | 4.089 | ||||
|
Targeted molecular therapy No vs. Yes |
0.581 | 0.825 | 0.416 | 1.636 | ||||
|
Primary therapy outcome SD/PD vs. CR/PR |
0.000 | 4.624 | 2.217 | 9.643 | 0.001 | 3.581 | 1.637 | 7.836 |
|
CGB5 expression >0 vs. =0 |
0.032 | 2.197 | 1.070 | 4.512 | 0.190 | 1.659 | 0.778 | 3.540 |
G1, well differentiated (low grade); G2, moderately differentiated (intermediate grade); G3, poorly differentiated (high grade); CR, complete remission; PR, partial remission; SD, stable disease; PD, progressive disease.
Table 3.
Univariate and multivariate analysis of OS/RFS in stage III/IV patients in TCGA‐STAD
| Parameters | Univariate analysis | Multivariate analysis | ||||||
|---|---|---|---|---|---|---|---|---|
| P | HR | 95% CI (lower/upper) | P | HR | 95% CI (lower/upper) | |||
| OS | ||||||||
| Age (Continuous) | 0.001 | 1.035 | 1.015 | 1.056 | 0.089 | 1.019 | 0.997 | 1.042 |
|
Gender Female vs. Male |
0.716 | 0.925 | 0.609 | 1.407 | ||||
|
Histological grade G3 vs. G1/G2 |
0.210 | 1.313 | 0.858 | 2.009 | ||||
|
Radiation therapy No vs. Yes |
0.000 | 3.663 | 1.974 | 6.796 | 0.064 | 1.954 | 0.962 | 3.971 |
|
Targeted Molecular therapy No vs. Yes |
0.000 | 2.240 | 1.472 | 3.408 | 0.051 | 1.637 | 0.999 | 2.682 |
|
H. pylori infection No vs. Yes |
0.188 | 1.868 | 0.737 | 4.734 | ||||
|
Primary therapy outcome SD/PD vs. CR/PR |
0.000 | 2.811 | 1.804 | 4.379 | 0.011 | 1.858 | 1.155 | 2.988 |
|
Residual tumor R1/R2 vs. R1 |
0.000 | 2.576 | 1.577 | 4.207 | 0.000 | 2.594 | 1.528 | 4.404 |
|
CGB5 expression >0 vs. =0 |
0.002 | 1.918 | 1.281 | 2.870 | 0.014 | 1.719 | 1.115 | 2.651 |
| RFS | ||||||||
| Age (Continuous) | 0.376 | 0.988 | 0.961 | 1.015 | ||||
|
Gender Female vs. Male |
0.128 | 0.543 | 0.247 | 1.193 | ||||
|
Histological grade G3 vs. G1/G2 |
0.088 | 1.999 | 0.903 | 4.426 | 0.049 | 2.362 | 1.003 | 5.565 |
|
Radiation therapy No vs. Yes |
0.015 | 3.174 | 1.257 | 8.018 | 0.040 | 2.841 | 1.048 | 7.703 |
|
Targeted Molecular therapy No vs. Yes |
0.467 | 0.767 | 0.374 | 1.570 | ||||
|
H. pylori infection No vs. Yes |
0.586 | 1.522 | 0.336 | 6.900 | ||||
|
Primary therapy outcome SD/PD vs. CR/PR |
0.000 | 3.686 | 1.812 | 7.500 | 0.006 | 2.810 | 1.338 | 5.901 |
|
Residual tumor R1/R2 vs. R0 |
0.283 | 1.688 | 0.650 | 4.386 | ||||
|
CGB5 expression >0 vs. =0 |
0.000 | 3.758 | 1.830 | 7.716 | 0.001 | 3.602 | 1.708 | 7.598 |
G1, well differentiated (low grade); G2, moderately differentiated (intermediate grade); G3, poorly differentiated (high grade); CR, complete remission; PR, partial remission; SD, stable disease; PD, progressive disease; R0, no residual tumor; R1, microscopic residual tumor; R2, macroscopic residual tumor.
CGB5 expression was independently associated with poor RFS in patients with advanced GC
Using RFS as an outcome indicator, we found that CGB5 expression was associated with poor RFS (P < 0.0001) (Fig. 5A). Subgroup analysis showed that the association was significant in both early (P = 0.028) (Fig. 5B) and advanced stages (P = 0.0001) (Fig. 5C). However, CGB5 expression was not an independent prognostic factor of RFS in early stages (HR: 1.659; 95% CI: 0.778–3.540, P = 0.190; Table 2). In comparison, its expression was independently associated with unfavorable RFS in advanced stages (HR: 3.602; 95% CI: 1.708–7.598, P = 0.001; Table 3).
Figure 5.

Kaplan–Meier curves of RFS in GC patients. (A–C) Kaplan–Meier curves of RFS in all patients (A), in early stages group (I/II) (B) and advanced stages group (III/IV) (C). Data were generated using data from TCGA‐STAD. Patients were divided into CGB5‐positive (>0) and negative (=0) groups.
CGB5 expression was not modulated by genetic amplification or DNA methylation in GC
Then, we tried to explore the mechanisms of CGB5 dysregulation using deep sequencing data from TCGA‐STAD. A total of 413 patients had DNA amplification and CGB5 expression measured at the same time (Fig. 6A). No significant difference was observed in different DNA amplification groups (Fig. 6B). A total of 372 patients had CGB5 DNA methylation and RNA expression measured simultaneously (Fig. 6C). Regression analysis showed that there was no significant correlation between CGB5 DNA methylation and its RNA expression (P = 0.27, Fig. 6D).
Figure 6.
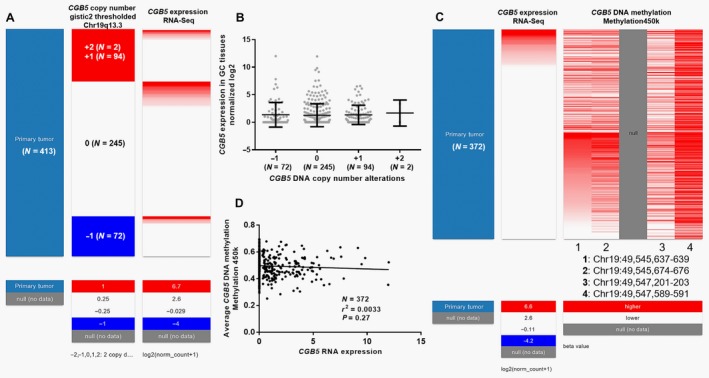
The association between CGB5 expression and its DNA amplification and methylation. (A–B) Heatmap (A) and plots chart (B) of CGB5 expression in groups with different genetic alterations. −1: heterozygous loss, 0: copy‐neutral, +1: low‐level copy gain, and +2: high‐level amplification. Heatmap (C) and regression analysis (D) of the correlation between CGB5 DNA methylation and its RNA expression.
Discussion
Ectopic expression of hCGβ has been associated with malignant behaviors in non‐trophoblastic tumors 19. As CGB5 is one of the key hCGβ encoding genes, we examined its expression profile in GC. Interestingly, our data showed that its expression was nearly not expressed in normal GC tissues. In comparison, its expression was detected in 214 of the 415 primary GC cases (51.6%) in TCGA‐STAD, suggesting that CGB5 expression was common among the patients. By examining CGB5 protein expression in the HPA, we found that CGB5 protein was not detectable in most of normal human tissues, including normal gastric tissues. Although CGB5 expression was not detected in 11 cases of GC tissues in the database, we could not exclude the possibility that some GC tumors might be CGB5 positive. Besides, we also found that its aberrant expression was significantly related to poor therapeutic responses. Therefore, in the future, it is meaningful to explore the possible therapeutic value of CGB5‐targeting drugs, such as anti‐CGB5 or antibody‐drug conjugate (ADC) 20, 21, in the potential CGB5‐positive cases.
Previous studies found that the structure of hCGβ shows significant morphological similarity with that of the “cystine knot growth factor” (CKGF) family members such as transforming growth factor β (TGFβ), platelet‐derived growth factor B (PDGFB), nerve growth factor (NGF), and vascular endothelial growth factors (VEGFs). The structural similarity suggests that there might be cross talk between these growth regulatory systems 22, 23. In fact, recent studies demonstrated that hCG acts as a proangiogenic factor in some tumors, which is similar to VEGF 22, 23. In ovarian cancer, CGB5 could enhance vasculogenic mimicry formation and upregulate the expression of the vascular markers CD31 12, 24. In addition, its upregulation also suppresses the apoptosis of the cancer cells by decreasing B‐cell lymphoma 2 (BCL2) and increasing BCL2‐associated X protein (BAX), and baculoviral IAP repeat containing 5 (BIRC5) transcription 13. In addition, HCGβ can also modulate the expression of epithelial‐to‐mesenchymal transition (EMT)‐related genes, including suppressing E‐cadherin and increasing phospho‐SMAD2, SNAIL and TWIST in colorectal cancer cells, the effects of which are similar to that of TGFβ 11. These findings suggest that hCGβ can induce EMT via the TGFβ signaling pathway. These mechanisms might help to explain why hCGβ upregulation is associated with malignant tumor behaviors.
Currently, clinicopathologic staging is the most important indicator of resectability and prognosis for GC. However, significant variations in response to primary therapies have been observed in patients with the same or similar stages 25, 26. Therefore, it is meaningful to explore other potential biomarkers of prognosis. Previous studies found that the serum hCGβ level has prognostic values in some cancers. It is an independent prognostic factor in urothelial transitional cell carcinoma (TCC) patients receiving chemotherapy for urothelial TCC in both curative and palliative settings 27. The OS in hepatocellular carcinoma patients with low serum concentrations of hCGβ is statistically and significantly better than in patients with elevated concentrations 28. Serum hCGβ level has been shown to be associated with unfavorable prognosis in colorectal cancer 11. In this study, we also examined the prognostic value of CGB5 in GC using data from two large databases (ICGC and TCGA). Our secondary analysis showed that that CGB5 expression was associated with higher ratios of recurrence and death in GC patients. By performing univariate and multivariate analysis based on the COX regression model, we confirmed that CGB5 expression was independently associated with inferior OS and RFS in advanced stages, but not in early stages of GC. Therefore, we infer that CGB5 expression might serve as a valuable prognostic marker in advanced GC patients. DNA amplification or hypomethylation are two common mechanisms of upregulated oncogenes in GC 29, 30, 31, 32. Using deep sequencing data from TCGA‐STAD, we failed to identify any significant associations between CGB5 expression and its DNA amplification or methylation. These results excluded the possibility of two common mechanisms of gene dysregulation in aberrant CGB5 expression in GC. Therefore, the exact mechanism of CGB5 expression should be explored in the future. In addition, although we showed the prognostic value of CGB5 expression, more studies are required to characterize the mechanism underlying its expression and GC development and/or therapeutic responses. Elucidation of the CGB5‐related signaling pathways is beneficial for future exploration of targeted therapeutic strategies.
Conclusion
CGB5 expression is common in GC patients, and its expression might independently predict poor OS and RFS in advanced stages, but not in early stages of GC.
Conflict of Interest
The authors have no conflict of interest.
References
- 1. Cole, L. A. 2009. New discoveries on the biology and detection of human chorionic gonadotropin. Reprod. Biol. Endocrinol. 7:8. [DOI] [PMC free article] [PubMed] [Google Scholar]
- 2. Nakamura, K. , and Yasuda N.. 1998. Suppression by beta‐mercaptoethanol of the intracellular hormonal dynamics of human chorionic gonadotropin‐beta subunit (hCG‐beta) in BeWo choriocarcinoma cells. Placenta 19:289–294. [DOI] [PubMed] [Google Scholar]
- 3. Vartiainen, J. , Lassus H., Lehtovirta P., Finne P., Alfthan H., Butzow R., et al. 2008. Combination of serum hCG beta and p53 tissue expression defines distinct subgroups of serous ovarian carcinoma. Int. J. Cancer 122:2125–2129. [DOI] [PubMed] [Google Scholar]
- 4. Arrieta, O. , Michel Ortega R. M., Angeles‐Sanchez J., Villarreal‐Garza C., Aviles‐Salas A., Chanona‐Vilchis J. G., et al. 2009. Serum human chorionic gonadotropin is associated with angiogenesis in germ cell testicular tumors. J. Exp. Clin. Cancer Res. 28:120. [DOI] [PMC free article] [PubMed] [Google Scholar]
- 5. Chang, E. , Lee E., Oh S. J., Kim J. S., and Kang C.. 2005. The immunoexpressions and prognostic significance of inhibin alpha and beta human chorionic gonadotrophins (HCG) in breast carcinomas. Cancer Res. Treat. 37:241–246. [DOI] [PMC free article] [PubMed] [Google Scholar]
- 6. Liao, X. H. , Wang Y., Wang N., Yan T. B., Xing W. J., Zheng L., et al. 2014. Human chorionic gonadotropin decreases human breast cancer cell proliferation and promotes differentiation. IUBMB Life 66:352–360. [DOI] [PubMed] [Google Scholar]
- 7. Murhekar, K. M. , Anuratha J. N., Majhi U., and Rajkumar T.. 2009. Expression of human chorionic gonadotropin beta in gastric carcinoma: a retrospective immunohistochemical study. Indian J. Med. Paediatr. Oncol. 30:99–102. [DOI] [PMC free article] [PubMed] [Google Scholar]
- 8. Aldaz‐Carroll, L. , Richon S., Dangles‐Marie V., Cocquebert M., Fournier T., Troalen F., et al. 2015. Specific detection of type II human chorionic gonadotropin beta subunit produced by trophoblastic and neoplastic cells. Clin. Chim. Acta 444:92–100. [DOI] [PubMed] [Google Scholar]
- 9. Hallast, P. , Nagirnaja L., Margus T., and Laan M.. 2005. Segmental duplications and gene conversion: human luteinizing hormone/chorionic gonadotropin beta gene cluster. Genome Res. 15:1535–1546. [DOI] [PMC free article] [PubMed] [Google Scholar]
- 10. Kolbl, A. C. , Schlenk K., Behrendt N., and Andergassen U.. 2017. The importance of hCG in human endometrial adenocarcinoma and breast cancer. Int. J. Biol. Markers. https://doi.org/10.5301/ijbm.5000290. [Epub ahead of print] [DOI] [PubMed] [Google Scholar]
- 11. Kawamata, F. , Nishihara H., Homma S., Kato Y., Tsuda M., Konishi Y., et al. 2017. Chorionic gonadotropin‐beta modulates epithelial‐mesenchymal transition in colorectal carcinoma metastasis. Am. J. Pathol. 188:204–215. [DOI] [PubMed] [Google Scholar]
- 12. Gao, S. , Fan C., Huang H., Zhu C., Su M., and Zhang Y.. 2016. Effects of HCG on human epithelial ovarian cancer vasculogenic mimicry formation in vivo. Oncol. Lett. 12:459–466. [DOI] [PMC free article] [PubMed] [Google Scholar]
- 13. Szczerba, A. , Sliwa A., Kubiczak M., Nowak‐Markwitz E., and Jankowska A.. 2016. Human chorionic gonadotropin beta subunit affects the expression of apoptosis‐regulating factors in ovarian cancer. Oncol. Rep. 35:538–545. [DOI] [PubMed] [Google Scholar]
- 14. Malkhasyan, K. , Deshpande H. A., Adeniran A. J., Colberg J. W., and Petrylak D. P.. 2013. The use of serum hCG as a marker of tumor progression and of the response of metastatic urothelial cancer to systemic chemotherapy. Oncology (Williston Park) 27:1028, 1030. [PubMed] [Google Scholar]
- 15. Rau, B. , Below C., Haensch W., Liebrich W., von Schilling C., and Schlag P. M.. 1995. Significance of serum beta‐hCG as a tumor marker for stomach carcinoma. Langenbecks Arch. Chir. 380:359–364. [DOI] [PubMed] [Google Scholar]
- 16. Office, I. D. A. C. , and Committee I. I. D. A.. 2016. Analysis of five years of controlled access and data sharing compliance at the International Cancer Genome Consortium. Nat. Genet. 48:224–225. [DOI] [PubMed] [Google Scholar]
- 17. Uhlen, M. , Fagerberg L., Hallstrom B. M., Lindskog C., Oksvold P., Mardinoglu A., et al. 2015. Proteomics. Tissue‐based map of the human proteome. Science 347:1260419. [DOI] [PubMed] [Google Scholar]
- 18. Uhlen, M. , Oksvold P., Fagerberg L., Lundberg E., Jonasson K., Forsberg M., et al. 2010. Towards a knowledge‐based Human Protein Atlas. Nat. Biotechnol. 28:1248–1250. [DOI] [PubMed] [Google Scholar]
- 19. Iles, R. K. 2007. Ectopic hCGbeta expression by epithelial cancer: malignant behaviour, metastasis and inhibition of tumor cell apoptosis. Mol. Cell. Endocrinol. 260–262:264–270. [DOI] [PubMed] [Google Scholar]
- 20. Yao, Y. , Yu L., Su X., Wang Y., Li W., Wu Y., et al. 2015. Synthesis, characterization and targeting chemotherapy for ovarian cancer of trastuzumab‐SN‐38 conjugates. J. Control Release 220(Pt A):5–17. [DOI] [PubMed] [Google Scholar]
- 21. Yao, Y. , Su X., Xie Y., Wang Y., Kang T., Gou L., et al. 2013. Synthesis, characterization, and antitumor evaluation of the albumin‐SN38 conjugate. Anticancer Drugs 24:270–277. [DOI] [PubMed] [Google Scholar]
- 22. Brouillet, S. , Hoffmann P., Chauvet S., Salomon A., Chamboredon S., Sergent F., et al. 2012. Revisiting the role of hCG: new regulation of the angiogenic factor EG‐VEGF and its receptors. Cell. Mol. Life Sci. 69:1537–1550. [DOI] [PMC free article] [PubMed] [Google Scholar]
- 23. Schanz, A. , Lukosz M., Hess A. P., Baston‐Bust D. M., Krussel J. S., and Heiss C.. 2015. hCG stimulates angiogenic signals in lymphatic endothelial and circulating angiogenic cells. J. Reprod. Immunol. 110:102–108. [DOI] [PubMed] [Google Scholar]
- 24. Su, M. , Wei W., Xu X., Wang X., Chen C., Su L., et al. 2011. Role of hCG in vasculogenic mimicry in OVCAR‐3 ovarian cancer cell line. Int. J. Gynecol. Cancer 21:1366–1374. [DOI] [PubMed] [Google Scholar]
- 25. Song, H. , Zhu J., and Lu D.. 2016. Molecular‐targeted first‐line therapy for advanced gastric cancer. Cochrane Database Syst. Rev. 7:CD011461. [DOI] [PMC free article] [PubMed] [Google Scholar]
- 26. Lemmens, V. E. , Dassen A. E., van der Wurff A. A., Coebergh J. W., and Bosscha K.. 2011. Lymph node examination among patients with gastric cancer: variation between departments of pathology and prognostic impact of lymph node ratio. Eur. J. Surg. Oncol. 37:488–496. [DOI] [PubMed] [Google Scholar]
- 27. Douglas, J. , Sharp A., Chau C., Head J., Drake T., Wheater M., et al. 2014. Serum total hCGbeta level is an independent prognostic factor in transitional cell carcinoma of the urothelial tract. Br. J. Cancer 110:1759–1766. [DOI] [PMC free article] [PubMed] [Google Scholar]
- 28. Lyytinen, I. , Lempinen M., Nordin A., Makisalo H., Stenman U. H., and Isoniemi H.. 2013. Prognostic significance of tumor‐associated trypsin inhibitor (TATI) and human chorionic gonadotropin‐beta (hCGbeta) in patients with hepatocellular carcinoma. Scand. J. Gastroenterol. 48:1066–1073. [DOI] [PubMed] [Google Scholar]
- 29. Cheng, L. , Wang P., Yang S., Yang Y., Zhang Q., Zhang W., et al. 2012. Identification of genes with a correlation between copy number and expression in gastric cancer. BMC Med. Genomics 5:14. [DOI] [PMC free article] [PubMed] [Google Scholar]
- 30. Pan, F. , Weeks O., Yang F. C., and Xu M.. 2015. The TET2 interactors and their links to hematological malignancies. IUBMB Life 67:438–445. [DOI] [PMC free article] [PubMed] [Google Scholar]
- 31. Zhou, B. , Wang Y., Jiang J., Jiang H., Song J., Han T., et al. 2016. The long noncoding RNA colon cancer‐associated transcript‐1/miR‐490 axis regulates gastric cancer cell migration by targeting hnRNPA1. IUBMB Life 68:201–210. [DOI] [PubMed] [Google Scholar]
- 32. Naseh, G. , Mohammadifard M., and Mohammadifard M.. 2016. Upregulation of cyclin‐dependent kinase 7 and matrix metalloproteinase‐14 expression contribute to metastatic properties of gastric cancer. IUBMB Life 68:799–805. [DOI] [PubMed] [Google Scholar]