
Figure 4. Investigating early fate transitions in human bone marrow CD34+ progenitors.
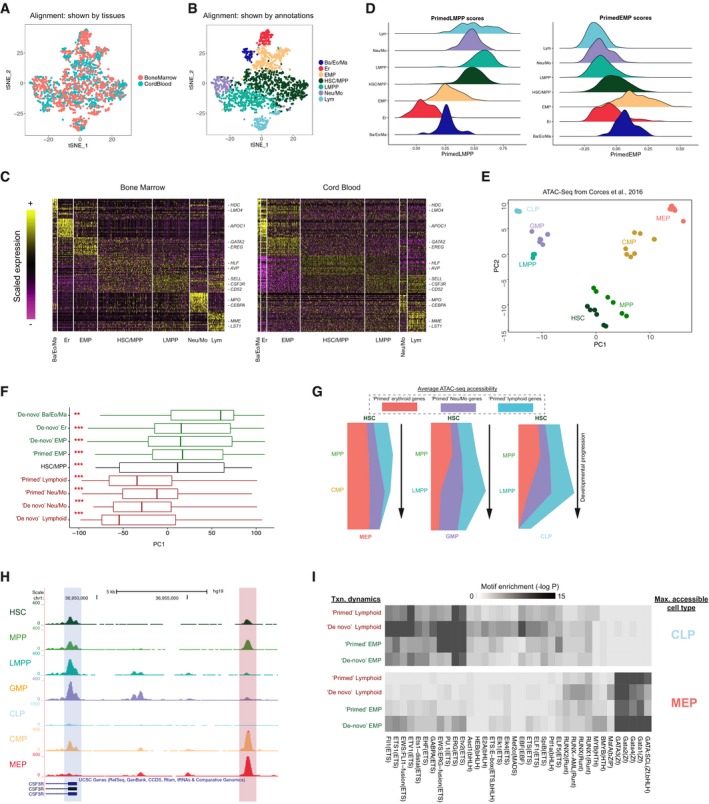
- tSNE representation of aligned CD34+ cells from bone marrow, and microclusters from cord blood.
- Joint annotation of the two integrated datasets (Materials and Methods).
- Heatmaps showing the expression of top enriched markers shared by annotated progenitors in bone marrow and cord blood. Expression values are scaled (z‐scored) for visualization.
- Ridge plots showing enrichment of expression programs in bone marrow CD34+ progenitors. Cells are colored and grouped by annotated progenitor types, and relative enrichment is represented by a scoring method from Tirosh et al (2016). Left: enrichment for “primed” LMPP genes (“primed” Lym and “primed” Neu/Mo genes); Right: “primed” EMP genes.
- Projections of nine transcriptomic gene modules onto ATAC‐seq PCA in (E). Modules segregate into two groups, with either significantly positive or negative PC1 scores, that are consistent with transcriptional dynamics in Fig 3A. Asterisks indicate that gene scores are significantly different from zero (***P < 10−5, **P < 0.01; Kolmogorov–Smirnov test). Vertical lines (left to right): first quartile, median, third quartile; whiskers: data points outside the first and the third quartiles.
- “River” plots, exhibiting quantitative remodeling of chromatin accessibility during differentiation from HSC into three downstream lineages. Width of the river corresponds to the average accessibility for “primary” peaks in this module (Materials and Methods). Peaks adjacent to “primed” genes are accessible for all lineages in early progenitors, but are maintained in only a single lineage during differentiation.
- Screenshot from UCSC genome browser showing data from Corces et al (2016). A peak near the TSS (blue shading) shows dynamics consistent with the “primed Neu/Mo” transcription of CSF3R, while another peak upstream (red shading) shows the opposing (“inconsistent”) dynamics.