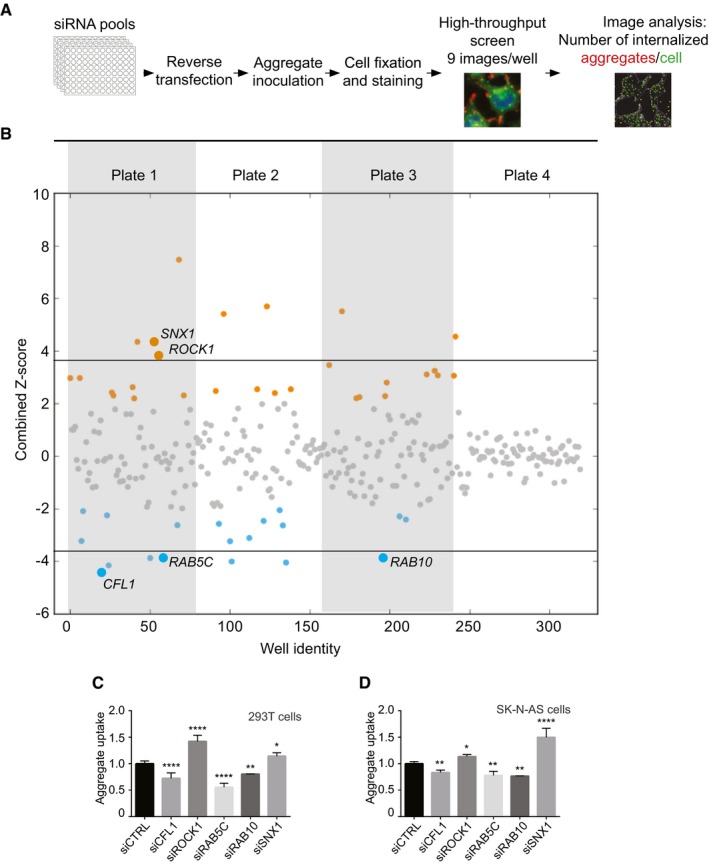
Scheme representing the experimental workflow.
Combined Z‐scores for each siRNA knockdown or mock transfection, presented as a scatter plot with the x‐axis indicating the screening well. Z‐score points representing hits above 2.0 are coloured in orange and below −2 in blue. Horizontal lines illustrate the Z‐score threshold (± 3.8) used for the secondary screen, selecting 15 of the most significant candidate genes.
Flow cytometry analysis of 293T cells 16 h after inoculation with 0.8 μM Dylight‐650‐SOD1H46R aggregates. Cells were transfected with the indicated siRNA or control (CTRL) siRNA 3 days before their inoculation with aggregates. Fluorescence intensity was measured by flow cytometry on 10,000 cells per sample (n = 2–5).
Flow cytometry analysis of SK‐N‐AS cells 1 h after inoculation with 0.8 μM Dylight‐650‐SOD1H46R aggregates and 3 days after transfection with the indicated siRNA. Fluorescence intensity was measured by flow cytometry on 10,000 cells per sample (n = 3–10).
Data information: Data are means ± SEM. *
P ≤
0.05, **
P ≤
0.01. ***
P ≤
0.001. ****
P ≤
0.0001. Results were analysed by ordinary one‐way ANOVA followed by multiple comparisons.
Source data are available online for this figure.

