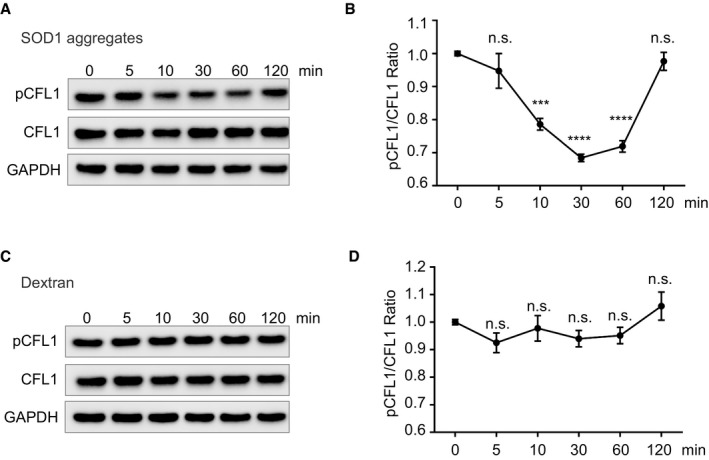
Figure 4. SOD1 aggregates transiently alter cofilin‐1 phosphorylation in cells.

- Immunoblots of the indicated proteins in lysates of SK‐N‐AS cells inoculated with SOD1 aggregates for the indicated time.
- Quantifications of triplicates of (A). The graph depicts the level of pCFL1 relative to total CFL1 during the SOD1 aggregates inoculation in SK‐N‐AS cells.
- SK‐N‐AS cells inoculated with dextran (Mr 10,000) for the indicated time were lysed and analysed by immunoblots with the indicated antibodies.
- Quantifications of triplicates of (C). The graph depicts the level of pCFL1 relative to total CFL1 during the dextran (Mr 10,000) inoculation in SK‐N‐AS cells.
