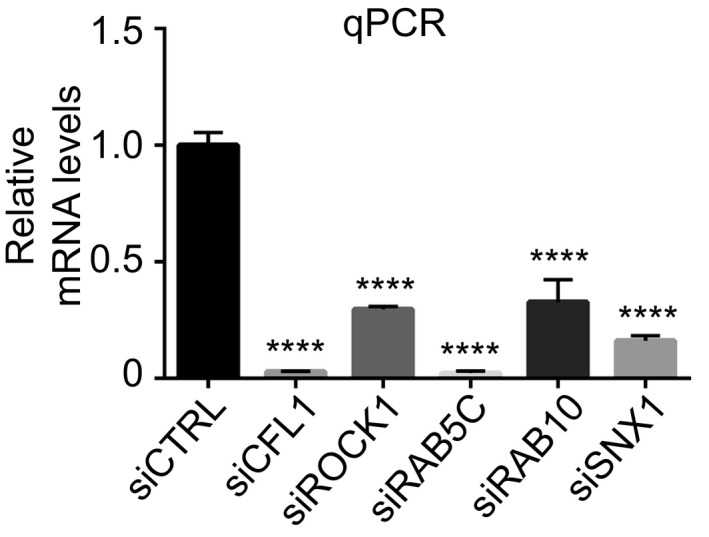
Figure EV4. siRNA knockdown of the five modifiers isolated in the screen.

mRNA levels measured by quantitative RT–PCR 2 days after transfection with the indicated siRNA. Data are means ± SEM (n ≥ 2). Ordinary one‐way ANOVA followed by multiple comparisons. ****P ≤ 0.0001.Source data are available online for this figure.
