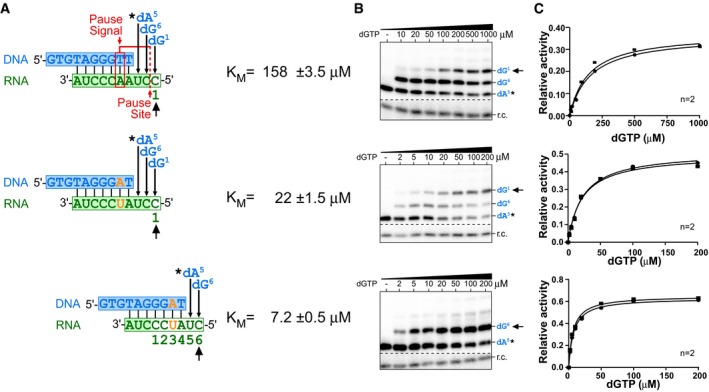
Figure EV3. K M measurement for nucleotide incorporations in the presence or absence of the pause signal.

- Sequences of the DNA/RNA hybrid substrates, position of the pause signal, and pause site (red). In vitro‐reconstituted TF telomerase was analyzed with specific DNA/RNA hybrid substrates to determine the K M for each nucleotide incorporation. Numbers below the DNA/RNA duplexes indicate positions corresponding to the telomerase template and the order of nucleotides incorporated. Mutations to disrupt the pause signal denoted (orange). The DNA products were labeled by incorporating a 32P‐dATP (0.165 μM, asterisk) prior to the K M measurement.
- Representative gels for K M measurements. An 32P end‐labeled DNA recovery control (r.c.) was added before product purification and precipitation. The nucleotide incorporation K M values measured are indicated (black arrow).
- Plots derived from the normalized intensity of the denoted (black arrow) nucleotide incorporation product over the total intensity of products for the specified nucleotide concentration. The Michaelis–Menten equation, Y = V max*X/(K M+X), was used to fit the nonlinear curve to determine the K M. Two or three replicates were performed for each measurement.
