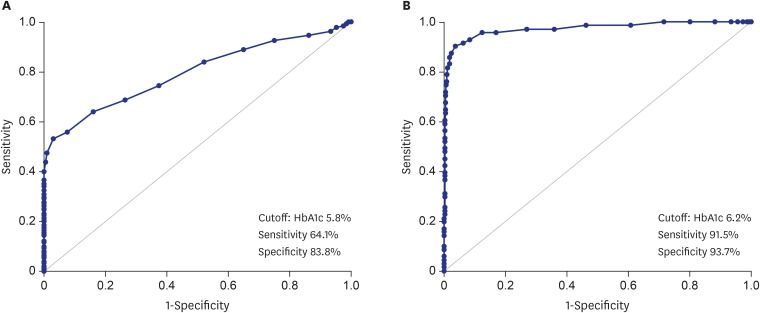
Fig. 1.
The receiver operating characteristic curve for HbA1c. (A) In the diagnosis of prediabetes and (B) type 2 DM, which corresponds to the AUC (95% CI) of 0.795 (0.750–0.840) for prediabetes and 0.972 (0.949–0.995) for type 2 diabetes.
HbA1c = hemoglobin A1c, DM = diabetes mellitus, AUC = area under the receiver operating characteristic curve, CI = confidence interval.

