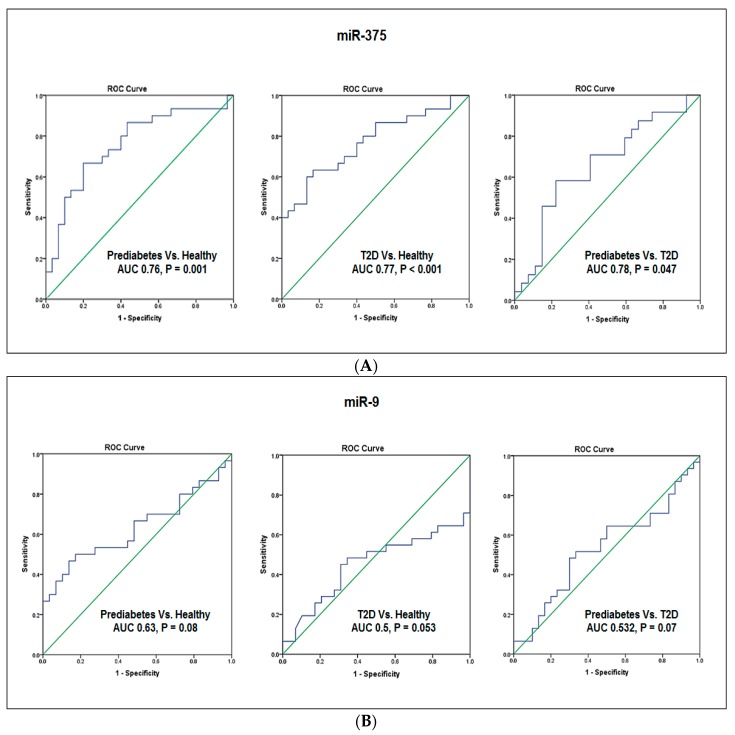
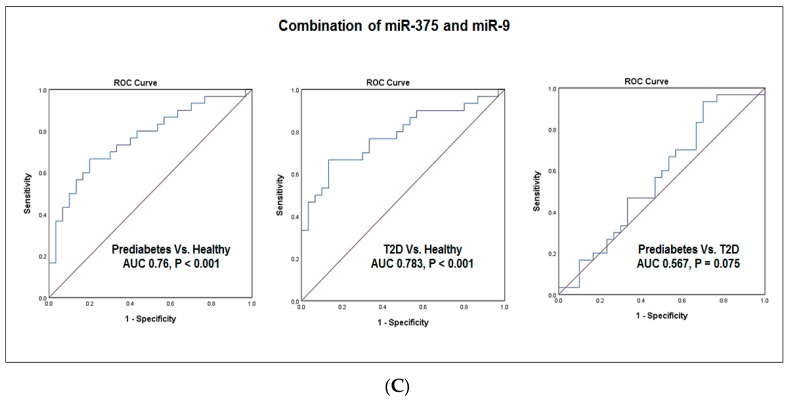
Figure 2.
Receiver operating characteristic curve analysis. Receiver operating characteristic (ROC) curves were constructed to evaluate the diagnostic values of miR-375 and miR-9 as biomarkers for prediabetes and T2D. (A) ROC curves for miR-375. (B) ROC curves for miR-9. (C) ROC curves for combination of miR-375 with miR-9.


