Figure 1.
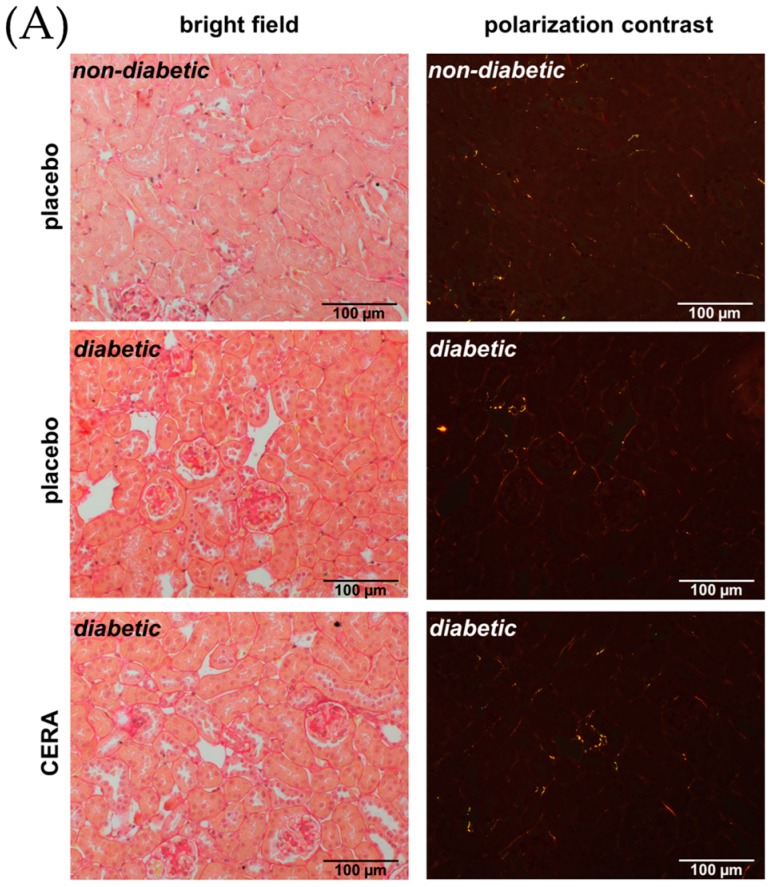
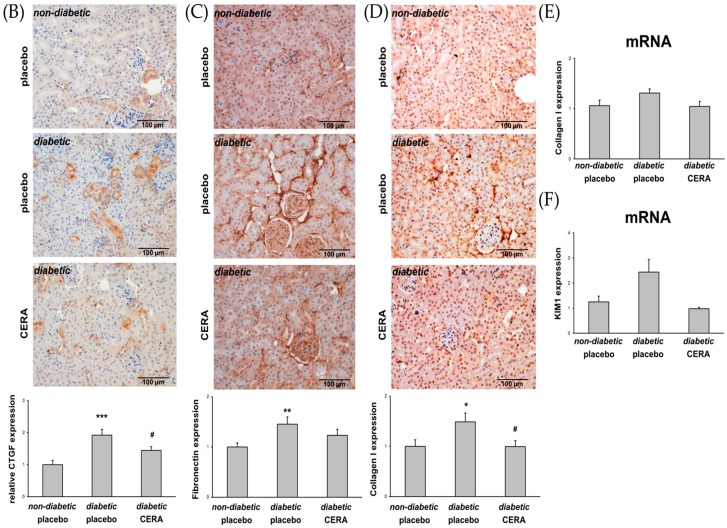
The tubulointerstitial fibrosis is reduced by CERA in diabetic kidneys. (A) Picrosirius red. Representative images of picrosirius red staining (magnification: 200×). Left: bright field illumination. Right: polarization contrast illumination. The color of the fibers shows the collagen content (increasing thickness: from green to yellow to orange to red); (B) CTGF. Representative images of CTGF immunohistochemistry (magnification: 200×) and semi-quantitative analysis of the staining (graph); (C) Fibronectin. Representative images of fibronectin immunohistochemistry (magnification: 200×) and semi-quantitative analysis of the staining (graph); (D) Collagen I. Representative images of collagen type I immunohistochemistry (magnification: 200×) and semi-quantitative analysis of the staining (graph); (E) Collagen I mRNA. Real-time PCR analysis of the renal collagen I mRNA expression. Values were normalized to the expression of housekeeping genes; (F) KIM1 mRNA. Real-time PCR analysis of the renal KIM1 mRNA expression. Values were normalized to the expression of housekeeping genes. Whereas placebo-treated diabetic animals show significant increase in all tested fibrosis marker, compared to non-diabetic controls, CERA treatment reveals anti-fibrotic effects in kidneys of diabetic mice. * p ≤ 0.05, ** p ≤ 0.01, *** p ≤ 0.001 = diabetic vs. non-diabetic control; # p ≤ 0.05 = db/db CERA vs. db/db placebo. The non-diabetic controls were assigned as an arbitrary value of 1.


