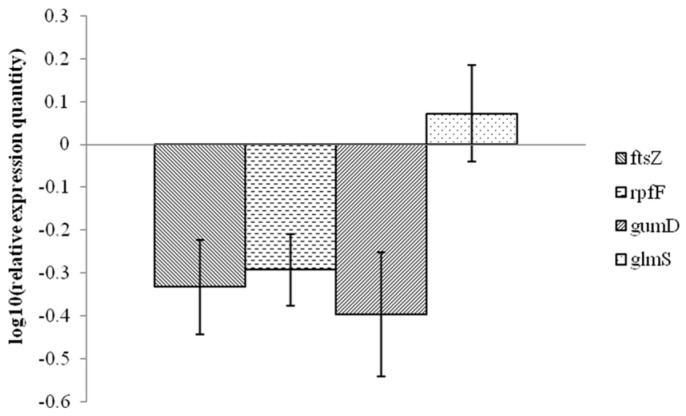
Figure 2.
Quantitative real-time PCR analysis of expression of four genes (rpfF, gumD, ftsZ, glmS) in X. oryzae pv. oryzae PXO99A in response to 1-DGlcNAc treatment. Values were normalized to the levels of 16S rRNA, an internal reference gene. The y-axis represents mean expression values ± SD relative to the control. The experiment was independently repeated three times.

