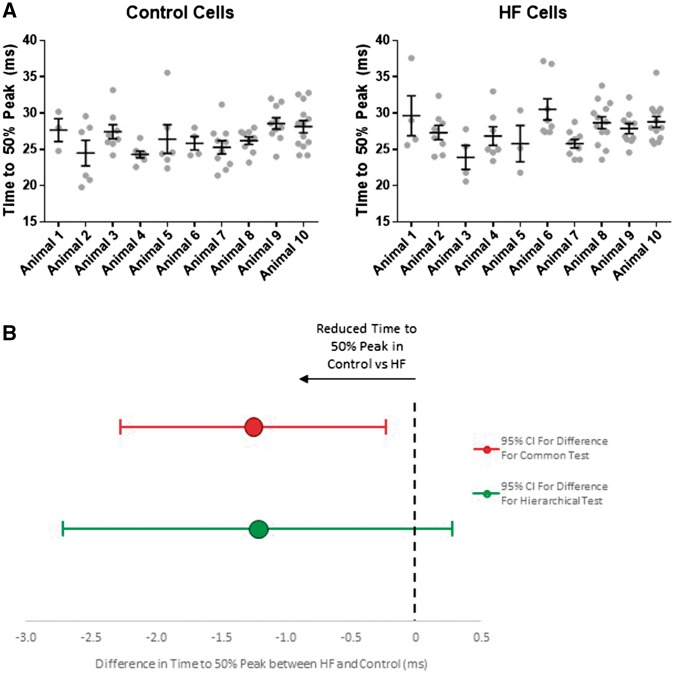
Figure 4.
Clustering of time to 50% peak transient amplitude. (A) Clustering of time to peak is shown with the time to 50% peak for transient in each cell (grey dots) shown for each rat in HF and control. The mean and standard error bars are shown for each rat. By eye the data appear clustered and this is confirmed by the statistical testing in Table 2. (B) The mean difference and confidence interval for the difference are shown which indicates why the difference between HF and control becomes non-significant with the corrected confidence intervals of the hierarchical test (green bars) compared with the uncorrected confidence intervals of the common test (red bars). There were 76 cells from 10 control rats and 79 cells from 10 HF rats.

