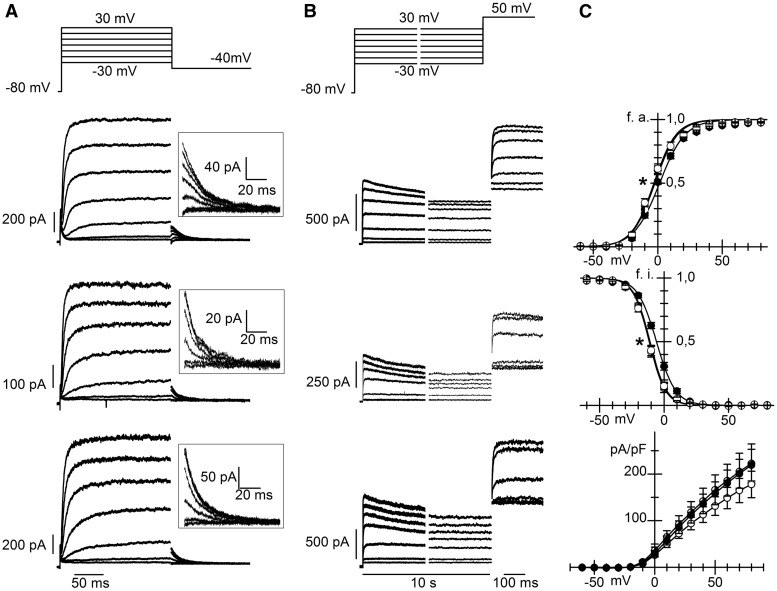
Figure 3.
The T78M cav-3 affects hKv1.5 channel properties. Representative current traces recorded from MEF-KO cells co-transfected with hKv1.5 and WT cav-3 (top), T78M cav-3 (centre), or both (bottom) during activation (A) and inactivation voltage protocols (B). Insets in A show, on an expanded scale, tail currents recorded at –50 mV used for activation curve analysis. (C) Mean activation curves (top; V1/2 values were: WT 1.41 ± 0.70 mV, n/exp = 27/13; T78M –2.63 ± 1.43*, n/exp = 23/11; WT/T78M –2.21 ± 1.15*, n/exp = 17/5), inactivation curves (centre; WT –5.9 ± 0.9 mV, n/exp = 24/12; T78M –10.9 ± 0.9*, n/exp = 24/11; WT/T78M –11.5 ± 0.6*, n/exp = 18/5) and current density-voltage relations (bottom, WT n/exp = 22/12, T78M n = 26/11, WT/T78M n = 21/5) in the three groups (WT filled circles, T78M open circles, WT/T78M half-filled circles,) *P < 0.05 by nested and One-way ANOVA with Fisher’s test.

