Figure 3.
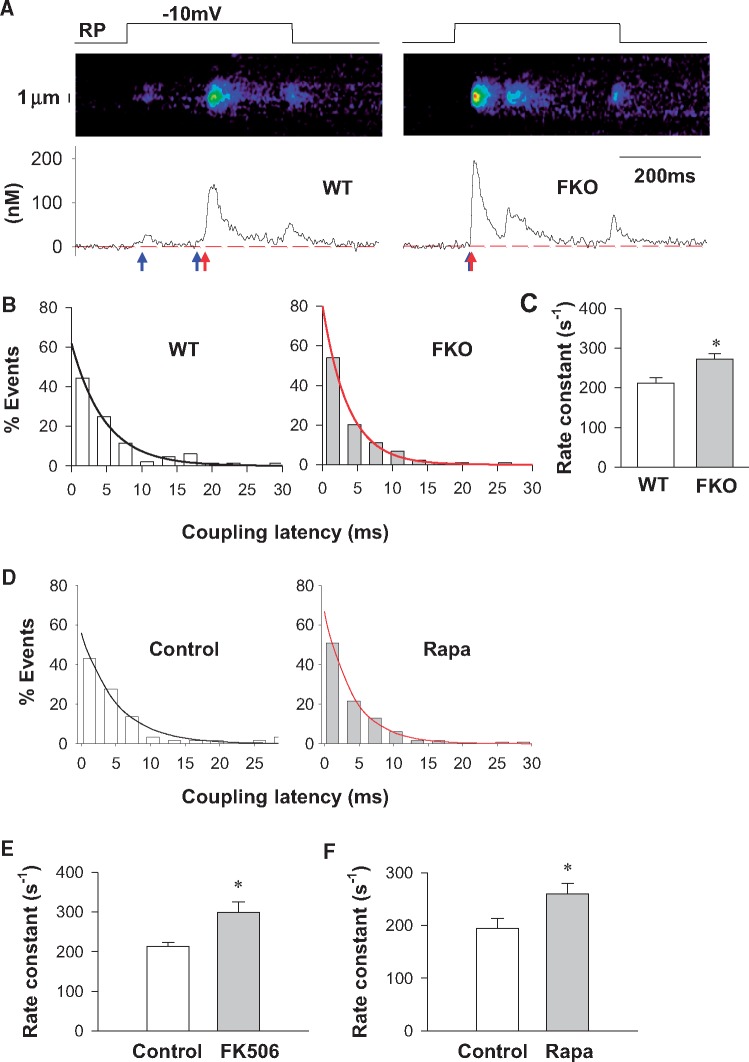
FKBP12.6 dysfunction accelerates the kinetics of LCC-RyR coupling. (A) Representative recordings from WT and FKO groups showing that depolarization to − 10 mV from resting potential (RP) (upper panels) triggered Ca2+ sparklets and Ca2+ sparks (middle panels for images and lower panels for time profiles) in a probabilistic manner. The blue and red arrows indicate the beginning of Ca2+ sparklets and Ca2+ sparks, respectively. (B) Distributions (bars) and exponential fittings (curves) of the coupling latency in WT and FKO groups. (C) Rate constants of LCC-RyR coupling in WT and FKO. (D) Distributions (bars) and exponential fittings (curves) of the coupling latency in WT under control and rapamycin-treated conditions. (E) Rate constants of LCC-RyR coupling in WT under control and FK506-treated conditions. (F) Rate constants of LCC-RyR coupling in WT under control and rapamycin-treated conditions. Data from ≥86 recordings in cells from ≥15 mice in each group. *P < 0.05 vs. WT or control.

