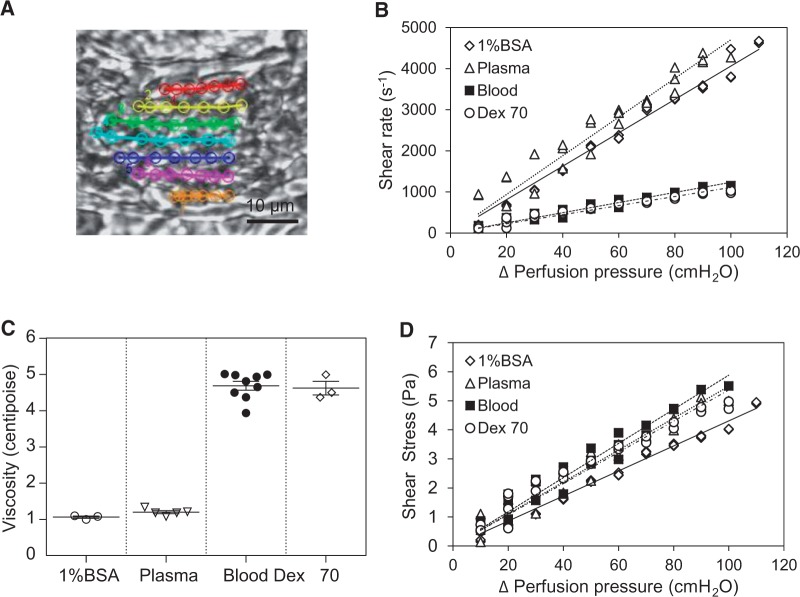
Figure 1.
Quantification of wall SS in intact venules. (A) One of the images of a blood perfused venule captured at 500 frames/s with tracking profile of RBC velocity. (B) Changes of shear rate as a function of perfusion pressure with different perfusates in a 40 μm diameter venule. (C) Summary of viscosity measurements (n = 9 whole blood; n = 5 plasma; n = 3 Dextran 70). (D) Changes of SS as a function of perfusion pressure (n = 3 per group).

