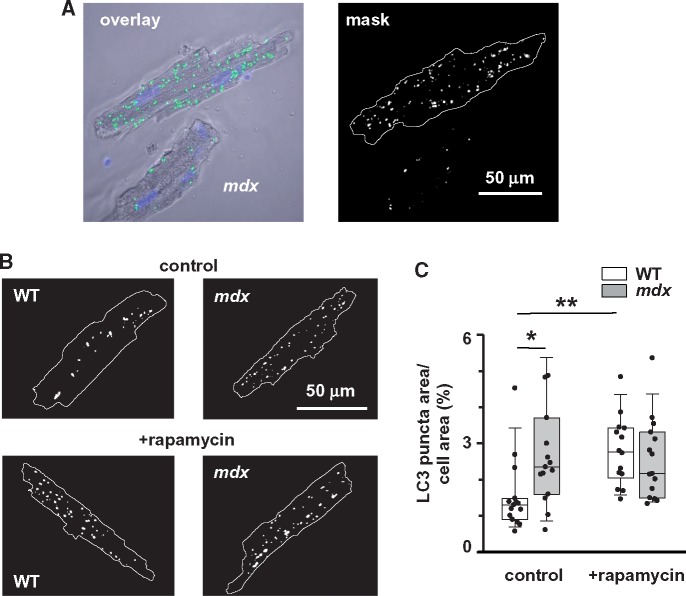
Figure 3.
LC3 puncta are more prominent in resting mdx cardiomyocytes. (A) Left panel shows typical overlay image of cardiomyocyte stained with anti-LC3 antibodies and then with Alexa Fluor 488-congugated secondary antibodies (green puncta on the image) and with nuclear fluorescent label DAPI (blue staining). Right panel shows binary image of the cardiomyocyte, where pixels with the numerical values above the preset threshold are marked in white. (B) Representative binary images of myocytes isolated from mdx and WT animals injected with either vehicle or rapamycin. (C) Pooled data of LC3 puncta area relative to area occupied by a cell in mdx and WT cardiomyocytes isolated from hearts of 12+ months old WT (N = 3, n = 14 and N = 3, n = 19) and mdx (N = 3, n = 15 and N = 3, n = 17) animals with and without rapamycin treatment, respectively. Data obtained from mdx tissue are shown as gray bars whereas white bars illustrate data acquired from WT tissue. (*P < 0.05, **P < 0.01, ANOVA test).

