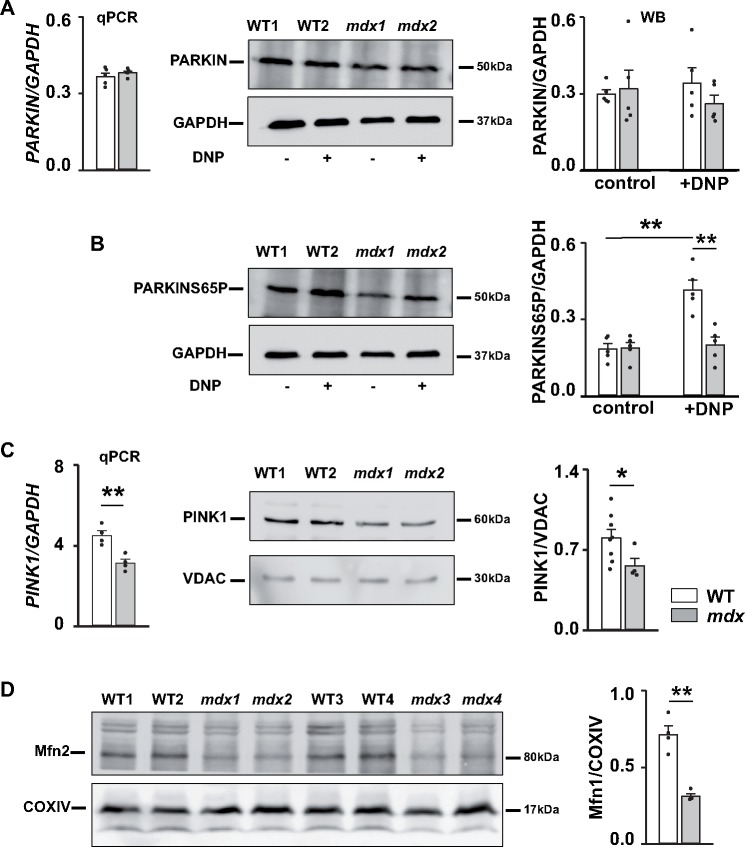
Figure 7.
Defects in PINK1/PARKIN-mediated mitophagy in dystrophic hearts. (A, B) Expression of PARKIN. Cardiac tissue was collected from mice treated with either vehicle (control) or DNP. qPCR was used to determine level of gene encoding PARKIN (left panel on A). Samples were also immunoblotted with anti-PARKIN (A), anti-PARKIN-S65P (B), and anti-GAPDH antibodies to determine levels of PARKIN protein and PARKIN protein phosphorylated at S65 residue (summarized at the graphs on the right panels). (C) Expression of PINK1. Cardiac tissue was collected from mice under control conditions. Graph on the left represents levels of expression of gene encoding PINK1. Samples were also immunoblotted with anti-PINK1 and anti-VDAC antibodies to determine protein levels of PINK1 (middle and right panels). (D) Expression of Mfn2 protein, which is involved in mitochondrial mitophagy and mitochondrial dynamics. Overall, samples from N = 3–8 12+ months old mdx and WT hearts were tested. Experiments were carried out on whole tissue homogenates. There were three replicates for each sample during qPCR measurements. Data obtained from mdx tissue are shown as gray bars whereas white bars illustrate data acquired from WT tissue. (*P < 0.05, **P < 0.01, ANOVA test).

