Figure 7.
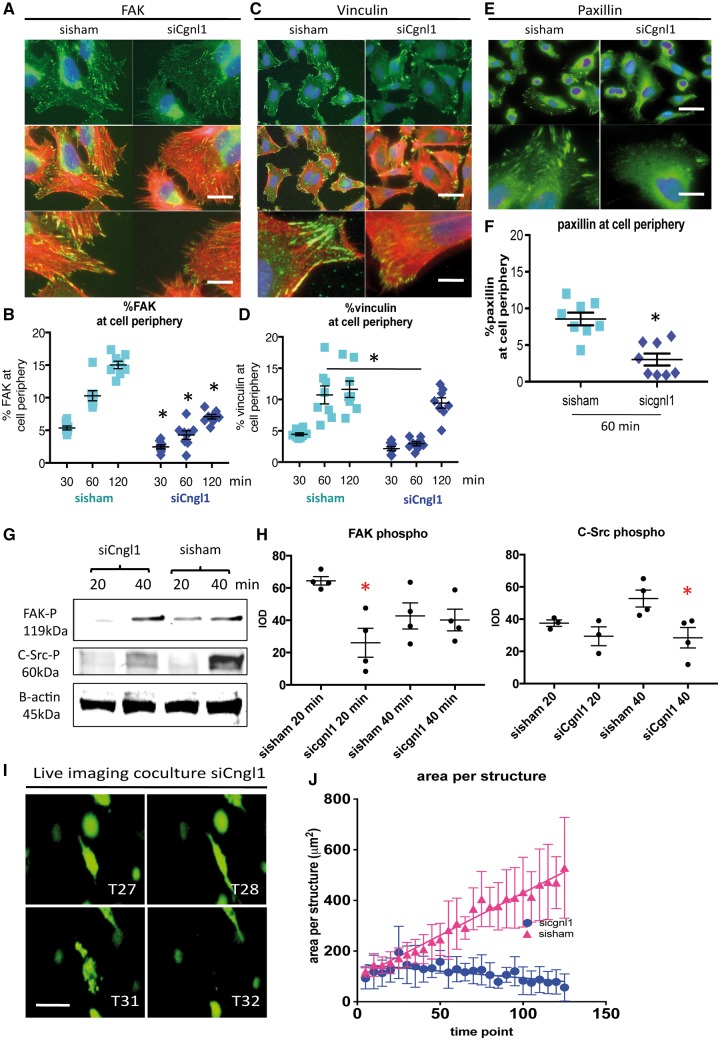
Cgnl1 inhibition hampers focal adhesion site assembly. Representative micrographs of intracellular immunostaining in HUVECs for (A) focal adhesion signalling protein FAK (FITC) and the actin cytoskeleton (Phalloidin Rhodamine), for focal adhesion proteins (C) vinculin and (E) paxillin, in sisham and siCgnl1 tranfected HUVECs after 1 h of adhesion to a gelatin/collagen coated underground. DAPI (blue signal). Upper two rows: Scale bar represents 5 μm. Lower rows show high magnification details. Scale bar represents 2 μm. Quantitative results of (B) %FAK, (D) % vinculin, and (F) %paxillin distribution at cell borders per image view adjusted for cell numbers at different time points of the adhesion assay. Values represent means ± SD. *P < 0.05 versus time point matched sisham conditions. Data obtained from 8 different experiments with analysis of 12 different micrographs per group per experiment. Two-way ANOVA. Western blot analysis at 20 and 40 min after seeding of (G) FAK-phospho-Y397 and (H) C-Src-phospho-Y418 proteins level in siCgnl1-treated HUVECs compared with control groups. Quantified values in graph are shown in mean IOD ± SD corrected for β actin loading controls. *P < 0.05 versus sisham and control of corresponding time points (n = 3–4). Student‘s t-test for comparison within 1 time point. β actin protein level was assessed as a loading control and did not differ between the control, sisham and siCgnl1 samples (data not shown). (I) Serial images of time-lapse imaging of HUVECs GFP cells seeded in 3D collagen coculture with pericytes in siCgnl1 group. Different time points (T) are shown. 1 time point represents 1 hour post seeding. Scalebar represents 10 μm. (J) Quantification of area per HUVEC-GFP+ structure (from T = 0 to 125 post-seeding). Each symbol represents average area per structure ± SD of five time points. Each time point is composed of five individual measurements. P < 0.0001, siCngl1 versus sisham group, linear regression analysis, overall comparison.

