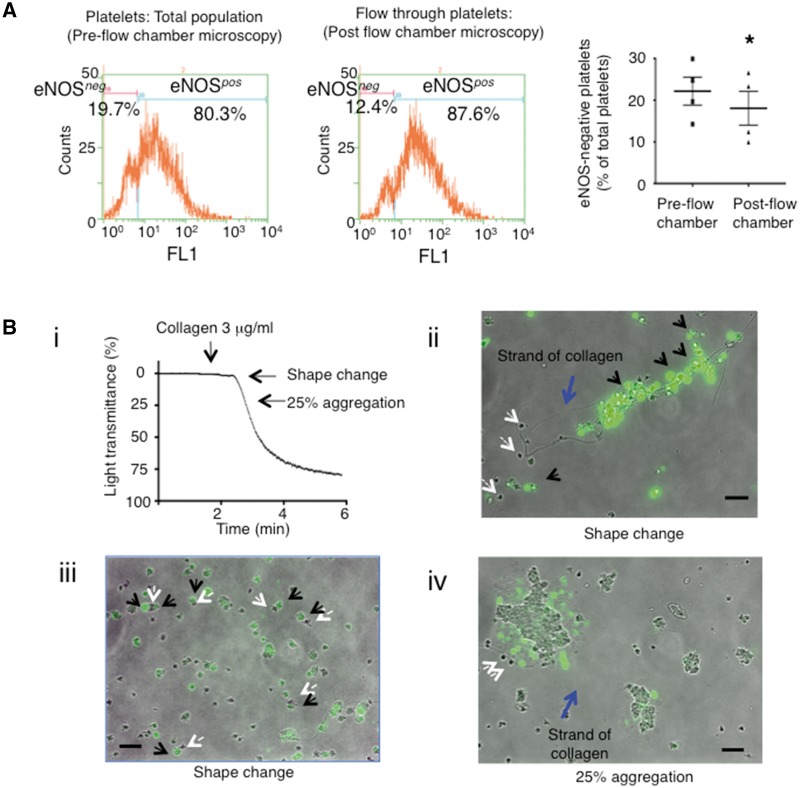
Figure 5.
eNOS-negative platelets initiate adhesion and aggregation reactions. (A) Representative platelet eNOSneg and eNOSpos platelet flow cytometry histograms and summary data pre- and post flow chamber experiments. N = 4. *P < 0.05. (B) (i) Representative platelet aggregometry trace indicating time points at which DAF-FM-stained platelet samples were taken for fluorescence microscopy. (ii-iv) Merged brightfield-fluorescence microscopy images of non/low-NO-producing and NO-producing platelets binding to collagen strands (blue arrows) and each other (iii). Black arrows indicate platelets producing large amounts of NO. White arrows indicate platelets producing little/no NO. Images representative from N = 3 independent experiments. Bars indicate 10 μm.

