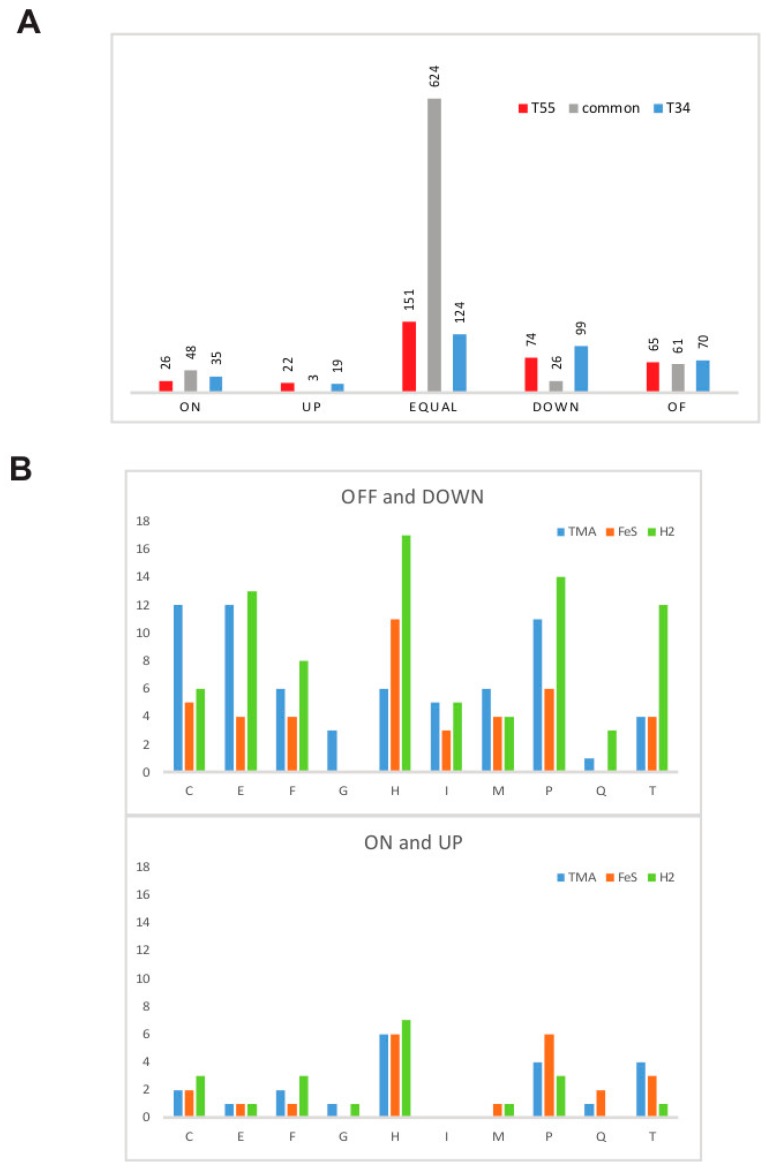
Figure 4.
Protein abundance changes in response to non-optimal conditions. (A) Comparison of response to supra- and suboptimal temperature conditions. The bars show the number of proteins. (B) Comparison of the response to different growth factors for different functional categories. The bars show the number of proteins. Upper panel show upregulated proteins and bottom panel show downregulated proteins. Functional categories are by one letter code as follows: E—Amino acid metabolism; F—nucleotide metabolism; G—Carbohydrate metabolism; H—Coenzyme metabolism; I —Lipid metabolism, M—Cell wall/membrane/envelop biogenesis; P—Inorganic ion transport and metabolism; Q—secondary metabolism.

