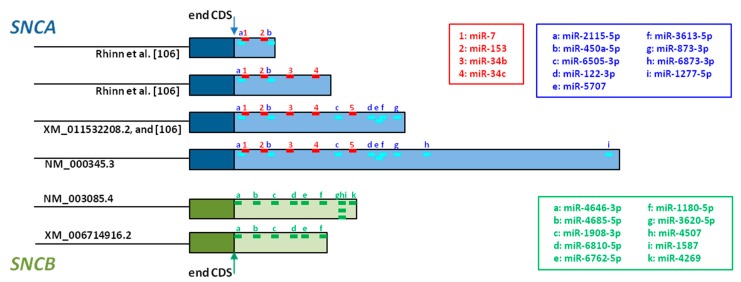
Figure 3.
Schematic representation of the 3’UTR of SNCA (blue) and SNCB (green). SNCA and SNCB transcripts that differ in their 3’UTR lengths are shown. Of the four SNCA transcripts, two have been described in the literature, but have not yet been included in the NCBI database. Colored short bars represent the miRNA binding sites, red—experimentally confirmed, blue—predicted for SNCA [178], green—predicted for SNCB, at the same website. CDS: coding sequence.

