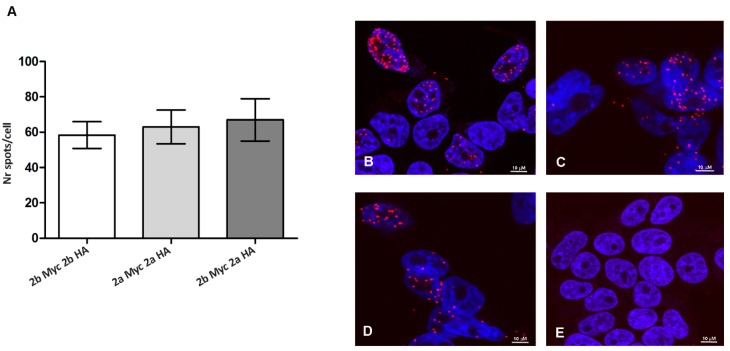
Figure 7.
PLA detection of ADAR2 dimers formation in HEK293T transfected cells. (A) PLA spots quantification. The graph reports the mean number of spots/cell; a minimum of 50 cells were analyzed for each experimental point; statistical analysis was performed using one-way ANOVA followed by Bonferroni post hoc test; (B) PLA dots for ADAR2b-Myc and ADAR2b-HA interaction; (C) PLA dots for ADAR2a-Myc and ADAR2a-HA interaction; (D) PLA dots for ADAR2b-Myc and ADAR2a-HA interaction; and (E) negative control: HEK293T Untransfected cells. Scale bar 10 µM.

