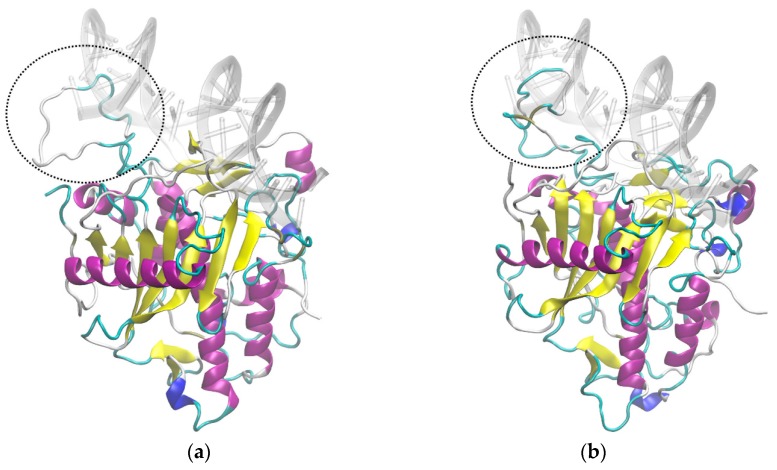
Figure 8.
Structures of: ADAR2a (a); and ADAR2b (b) from MD simulations. The RNA shown is taken from the PDB crystal structure 5HP2 after fitting of the protein backbone atoms. The two selected structures are those with maximum overlap with RNA among those collected in the respective MD simulations. Dashed circles show the main overlap region.

