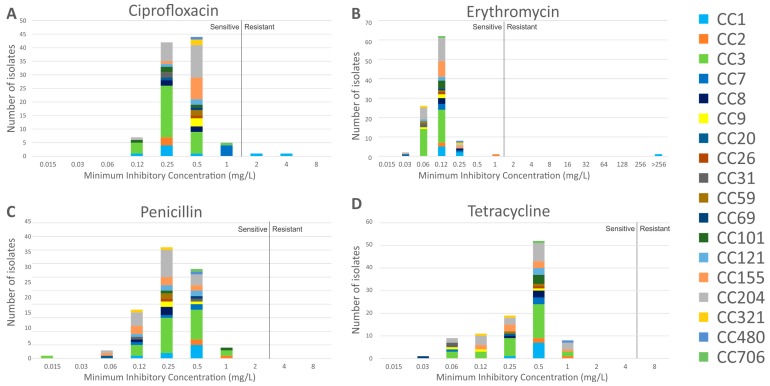
Figure 2.
Minimum Inhibitory Concentration (MIC) values of isolates in this study to the panel of four antibiotics. Breakpoints are indicated by a vertical black line in each graph; MICs to the left of this are considered sensitive, while those to the right are considered resistant. Breakpoints (mg/L): Ciprofloxacin S ≤ 1, R > 1; Erythromycin S ≤ 1, R > 1; Penicillin S ≤ 2, R > 2; Tetracycline S ≤ 4, R > 4. CC, clonal complex.

