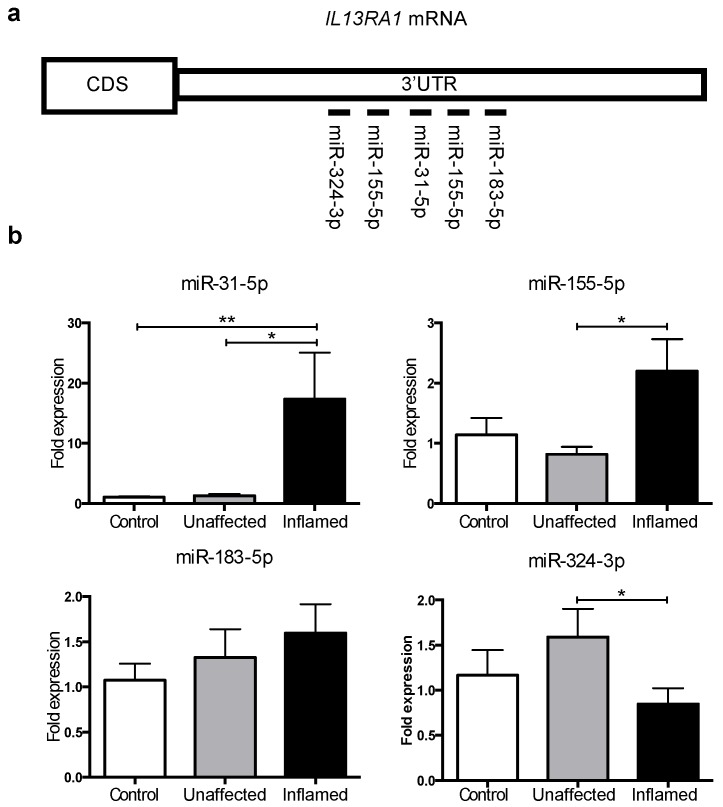
Figure 2.
MicroRNAs predicted to target IL13RA1 mRNA expression levels in UC colonic biopsies: (a) Schematic of the 3′UTR of IL13RA1 mRNA representing the approximate locations for predicted (validated for miR-155) miR binding sites (Table S1); and (b) Bar graphs depicting the expression levels of miR-31-5p, miR-155-5p, miR-183-5p and miR-324-3p in colonic biopsies from non-UC patients (Control), unaffected tissue (Unaffected) and their matched inflamed colonic tissue samples taken from the same patient (Inflamed) (n = 7 on each group) relative to Control. Represented are mean + standard error of the mean. Data were normalised to expression of small nucleolar RNA C/D Box 44 (RNU44) prior to performing one-sided t-tests (paired for Unaffected vs. Inflamed or unpaired when comparing against Control). *: p-value ≤ 0.05; **: p-value ≤ 0.01.

