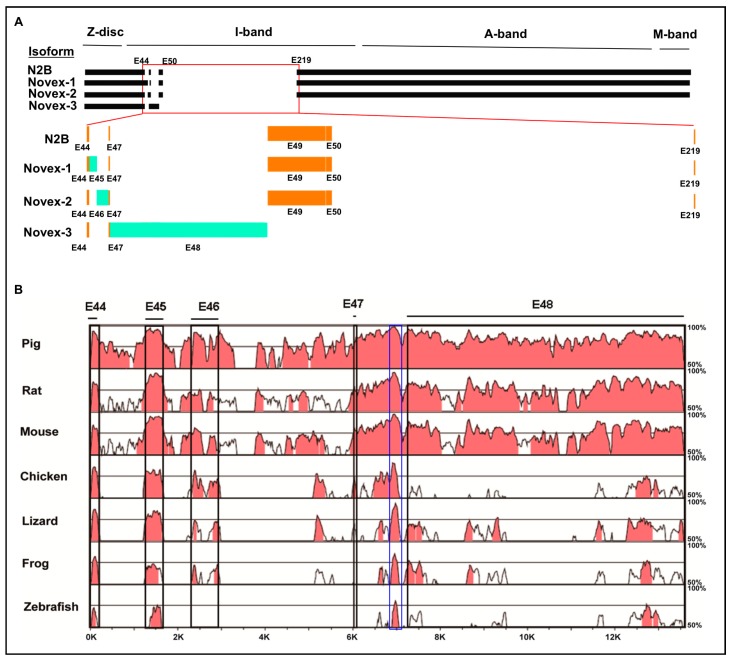
Figure 1.
Schematic splicing pattern of titin (TTN) Novexes 1, 2, and 3 and conserved sequence analysis of other species to human sequence using mVISTA software. (A) Schematic splicing pattern of TTN Novexes 1, 2, and 3 with comparison to N2B isoform. (B) Sequence comparison of exons 44–48 in the Novex-1, -2, and-3 mutually exclusive splicing regions between species. Blue box indicates a highly conserved region between exon 47 and 48. Percentage on the right side represents sequence homology by comparing to human sequence. Large percentage of the red region indicates a high sequence homology to human sequence. E: Exon.

