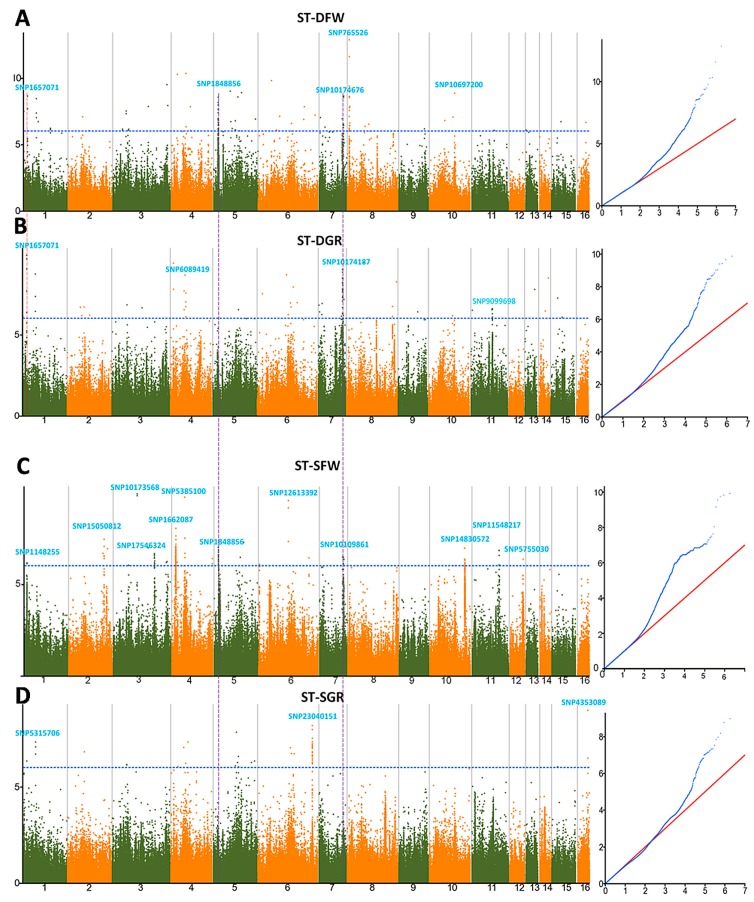
Figure 5.
Manhattan plots and QQ plots of genome-wide association studies using the Mixed model for drought and salt tolerance indexes. (A) ST-DFW; (B) ST-DGR; (C) ST-SFW; (D) ST-SGR. The significant trait-associated QTLs commonly identified for the two indexes of the same stress are highlighted with dotted red lines and those commonly identified for drought and salt stresses are highlighted with dotted purple lines. QQ plot: Quantile-Quantile plots.

