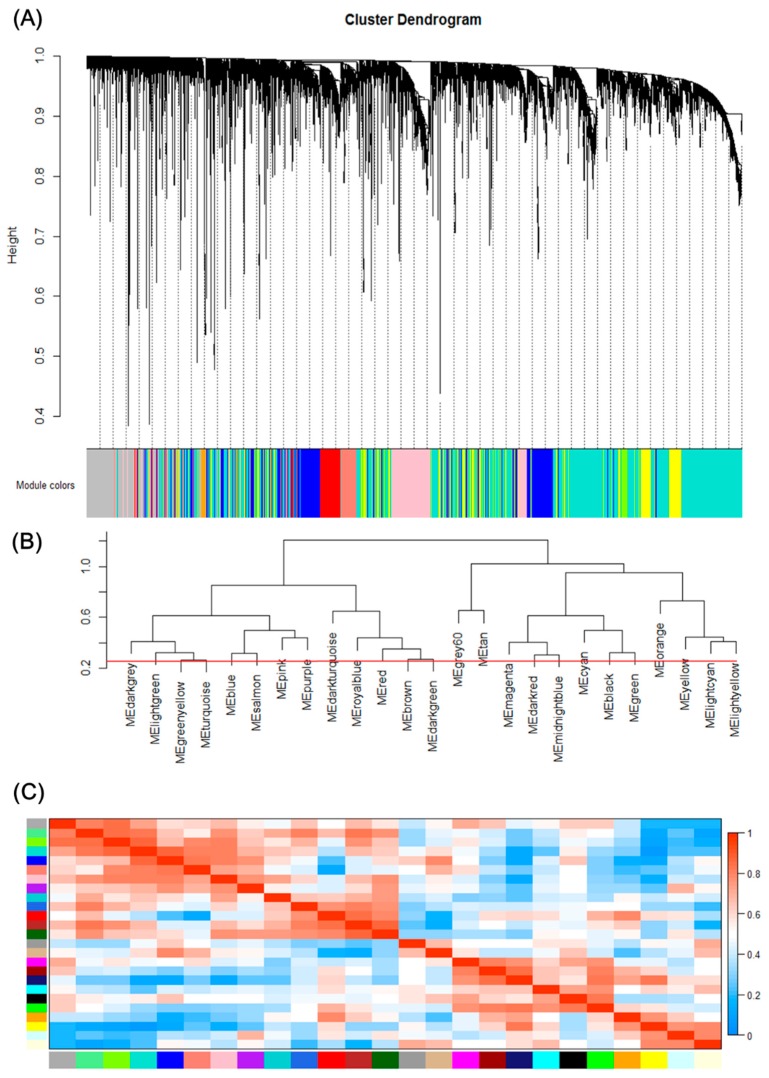
Figure 2.
Gene modules identified by Weighted gene co-expression network analysis (WGCNA). (A) Gene dendrogram obtained by clustering the dissimilarity based on consensus Topological Overlap with the corresponding module colors indicated by the color row. Each colored row represents a color-coded module which contains a group of highly connected genes. A total of 25 modules were identified. (B) Dendrogram of consensus module eigengenes obtained by WGCNA on the consensus correlation. The red line is the merging threshold, and groups of eigengenes below the threshold represent modules whose expressions profiles should be merged due to their similarity. (C) Heatmap plot of the adjacencies of modules. Red represents high adjacency (positive correlation) and blue represents low adjacency (negative correlation).

