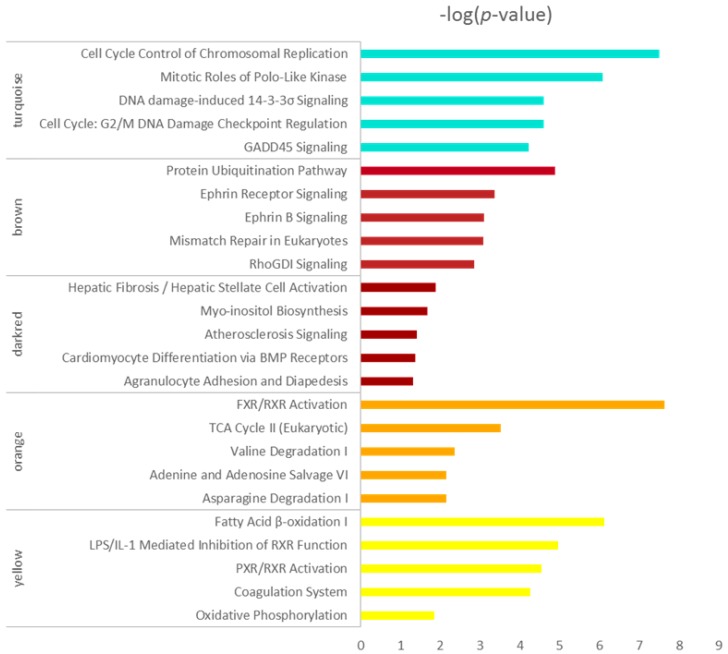
Figure 4.
Top 5 enrichment results of canonical pathway analysis by ingenuity pathway analysis (IPA) for co-expressed genes in turquoise, brown, darkred, orange and yellow modules. Pathway names are shown on the left, and the bars on the right represent the −log(p value) of the corresponding pathway. The different colors of the bars are in accordance with the corresponding modules.

