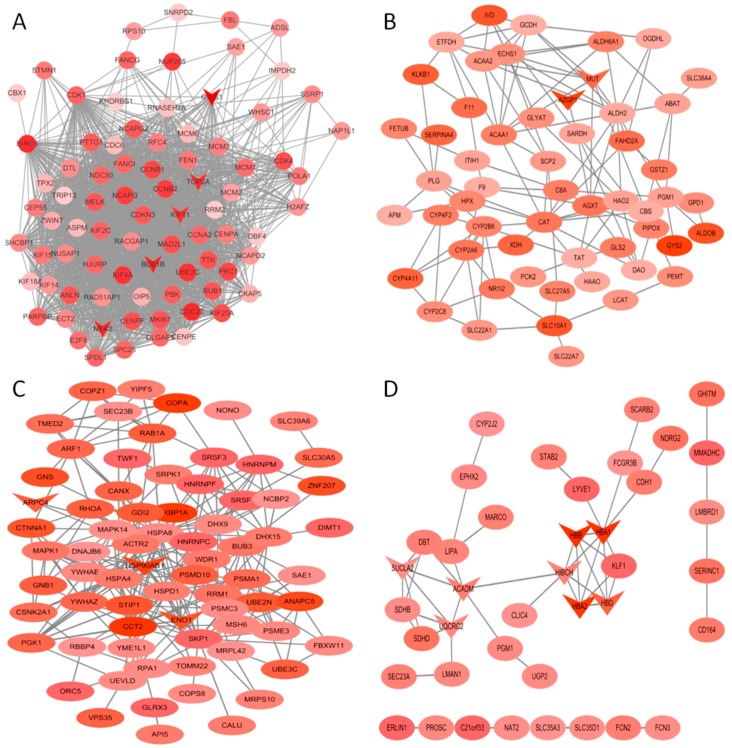
Figure 5.
Protein-protein interaction (PPI) network of genes in the turquoise (A), yellow (B), brown (C) and orange (D) modules. The density of the ellipse corresponds to module membership (kME) values. The network was constructed using Cytoscape 3.4 software. The genes with a v-shape represent the high-degree genes from cytohubba.

